Free Access
Fig. A.1
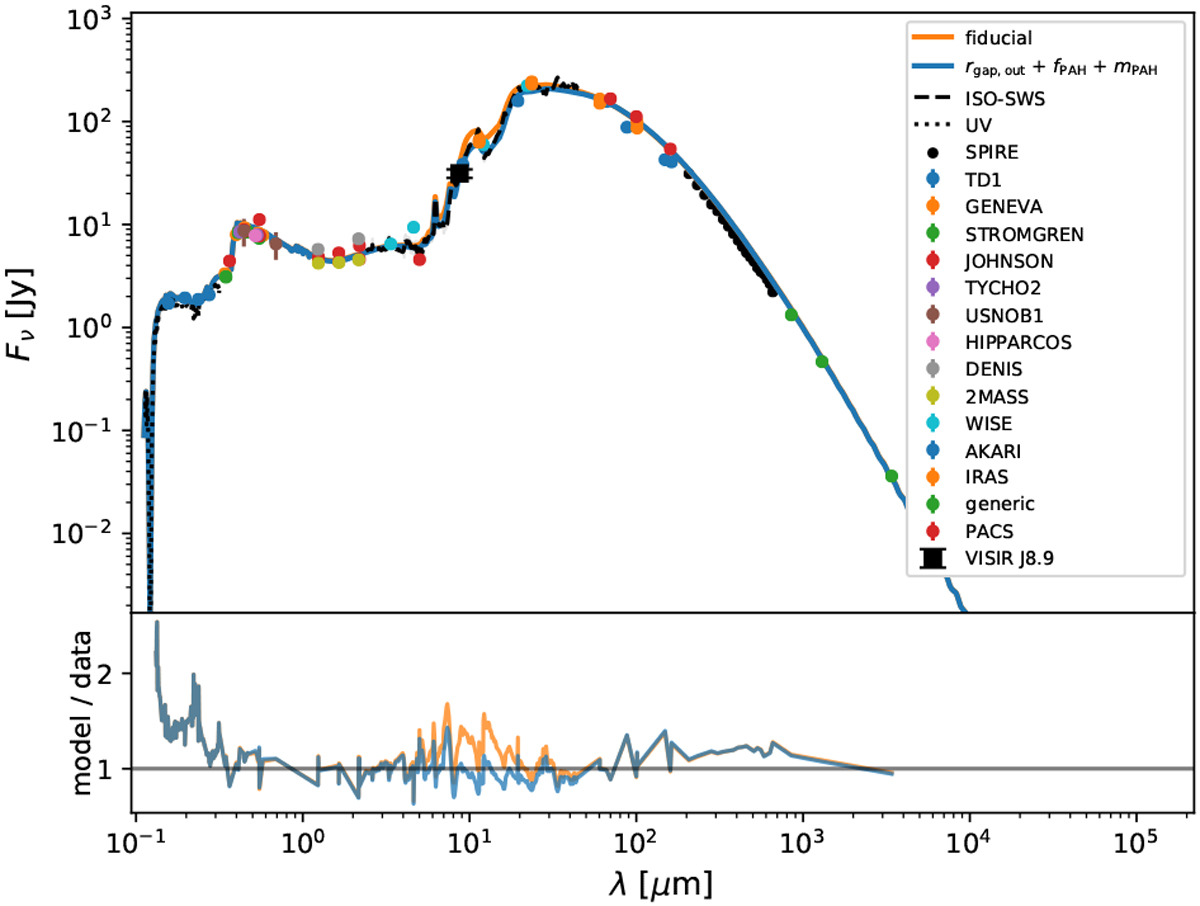
Global SED of the HD 100546 disk models and comparison to the observational data folded into the fit. The fiducial model SED is the orange curve and our adjusted disk gap geometry model is the blue curve. The relative residual as defined by dividing the model by the data is shown at the bottom.
Current usage metrics show cumulative count of Article Views (full-text article views including HTML views, PDF and ePub downloads, according to the available data) and Abstracts Views on Vision4Press platform.
Data correspond to usage on the plateform after 2015. The current usage metrics is available 48-96 hours after online publication and is updated daily on week days.
Initial download of the metrics may take a while.