Fig. 7
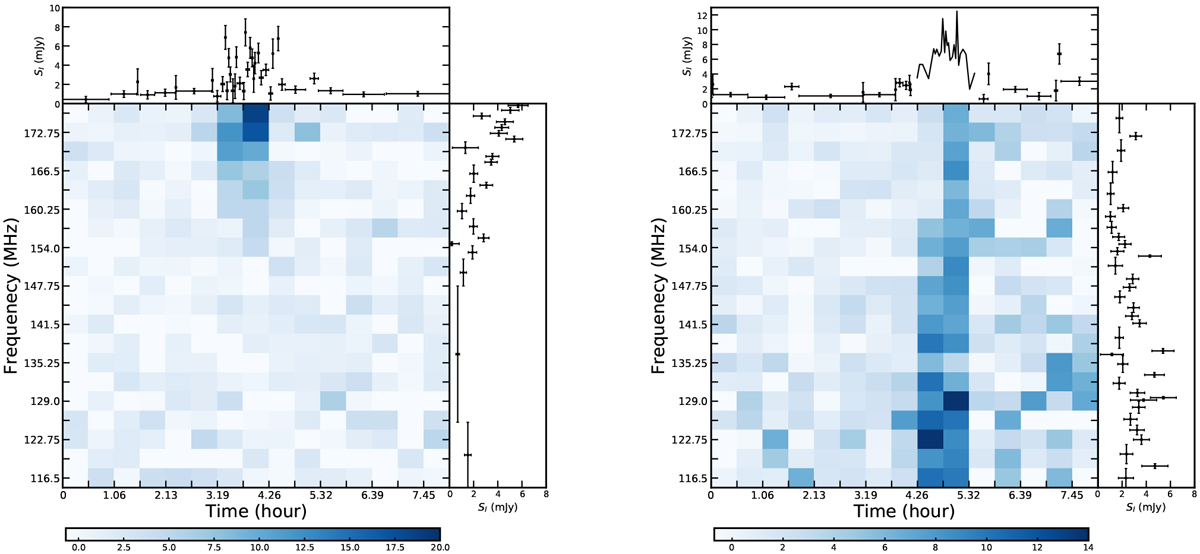
Total-intensity dynamic spectra of the bursts detected from CR Dra in the 2014-05-19 (left panel) and 2015-06-07 (right panel) epochs formed in image space. The median noise for both epochs is ≈1.5 mJy. The bursts reach ≈19 and ≈14 mJy for the 2014-05-19 and 2015-06-07 epochs, respectively. The colour bar at the bottom of each panel communicates the flux densityscale in mJy for the corresponding observation. The top and right-hand plots on each pseudo-dynamic spectrum are the lightcurve and spectrum of CR Dra if integrating completely over bandwidth and duration, respectively. For high signal-to-noise areas, the flux density is represented with a line that has uncertainty to better than 10%. The side plots show that CR Dra is detected at all times and at all frequencies for both epochs.
Current usage metrics show cumulative count of Article Views (full-text article views including HTML views, PDF and ePub downloads, according to the available data) and Abstracts Views on Vision4Press platform.
Data correspond to usage on the plateform after 2015. The current usage metrics is available 48-96 hours after online publication and is updated daily on week days.
Initial download of the metrics may take a while.