Fig. 4
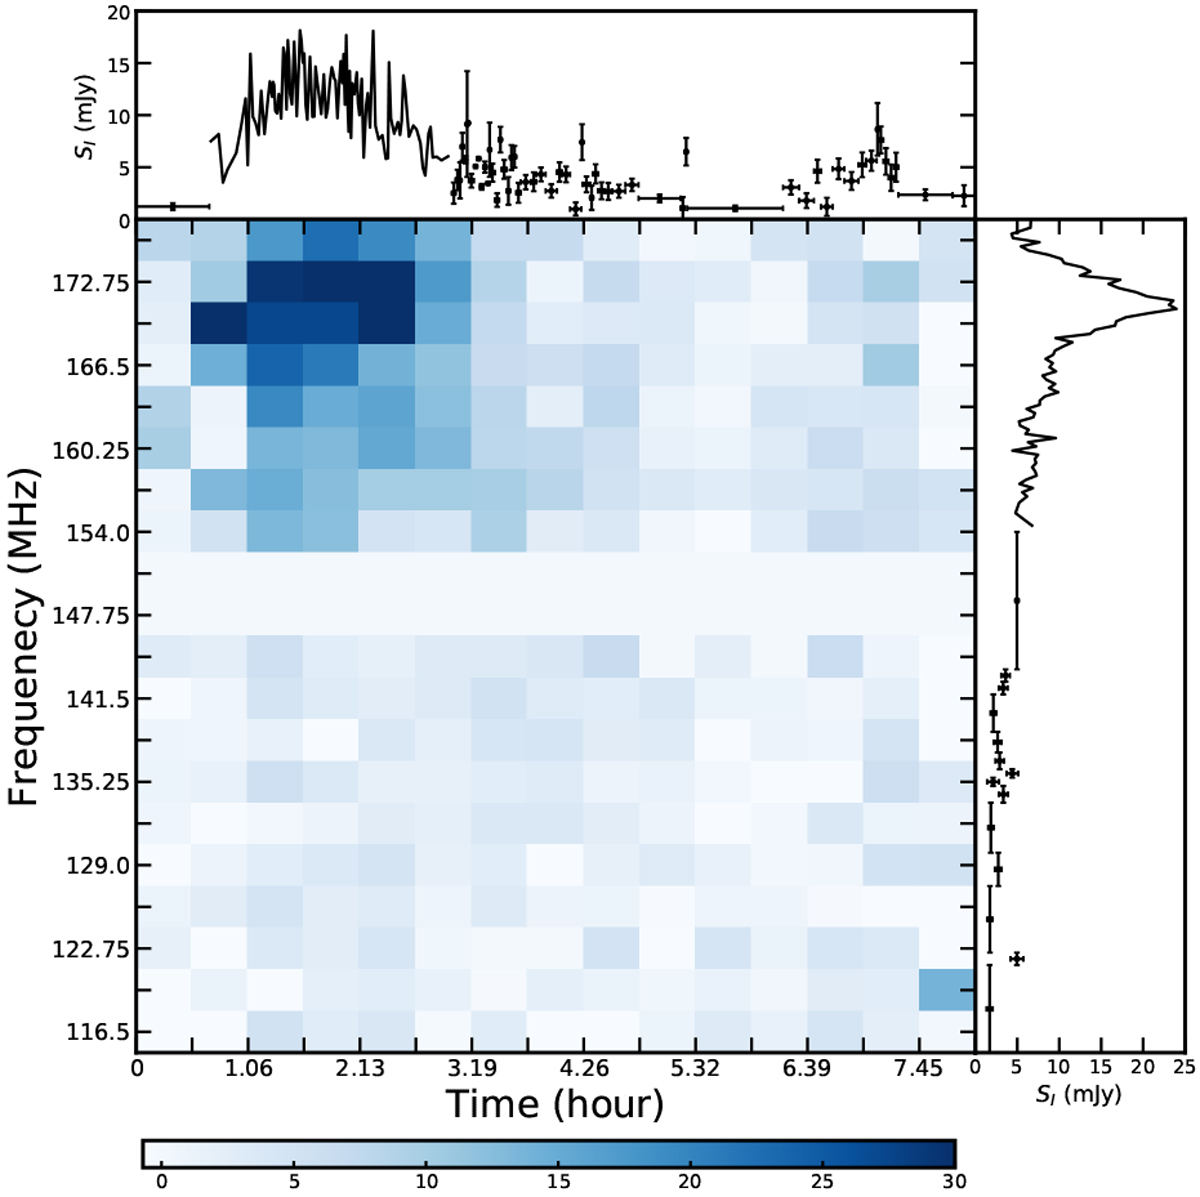
Dynamic spectrum formed from images of CR Dra for the 2014-06-02 epoch in total intensity. The median noise in each image used to form this dynamic spectrum is 1.7 mJy, with ≈25% of the pixels corresponding to a ≥3σ detection. The burst in the upper-left saturates at ≈40 mJy. The colour bar at the bottom communicates the flux density scale in mJy. The white bar centred around ≈150 MHz correspondsto the frequency range for which radio frequency interference prevented reliable data being recovered. Top and righthand panels: lightcurve and spectrum of CR Dra if integrating completely over bandwidth and duration, respectively.For high signal-to-noise areas, the flux density is represented with a line that has uncertainty to better than 10%. These two side plots show that CR Dra is detected at all times and at all frequencies.
Current usage metrics show cumulative count of Article Views (full-text article views including HTML views, PDF and ePub downloads, according to the available data) and Abstracts Views on Vision4Press platform.
Data correspond to usage on the plateform after 2015. The current usage metrics is available 48-96 hours after online publication and is updated daily on week days.
Initial download of the metrics may take a while.