Fig. 3
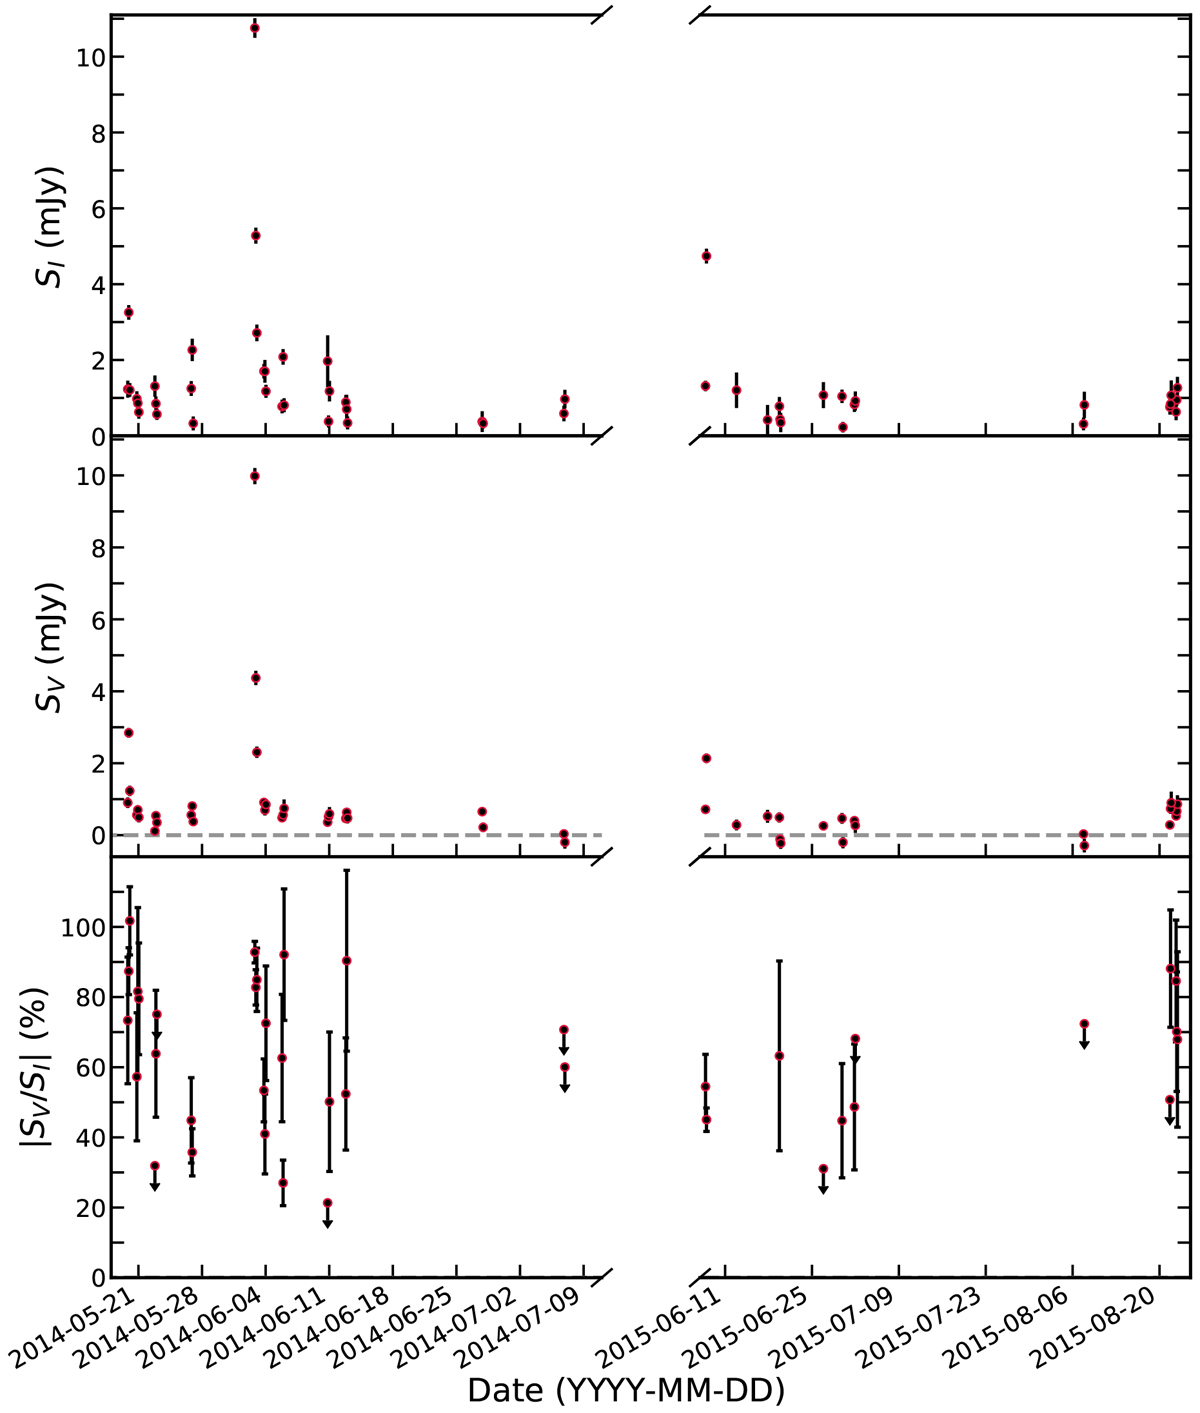
Longterm 146 MHz radio lightcurve of CR Dra in total intensity SI (top panel), circular polarisation SV (middle panel), and the ratio |SV∕SI|. Only positive Stokes V emission is detected, implying we observe only left-hand circularly polarised emission from CR Dra. Uncertainties represent 1σ and are only shown if larger than the symbol size. The ratio |SV∕SI| is plotted if the corresponding signal-to-noise ratio of CR Dra is ≥3σ in both Stokes I and Stokes V emission. We show 3σ upperlimits for |SV∕SI| if the emission in Stokes I is ≥ 3σ but < 3σ in Stokes V.
Current usage metrics show cumulative count of Article Views (full-text article views including HTML views, PDF and ePub downloads, according to the available data) and Abstracts Views on Vision4Press platform.
Data correspond to usage on the plateform after 2015. The current usage metrics is available 48-96 hours after online publication and is updated daily on week days.
Initial download of the metrics may take a while.