Fig. 1
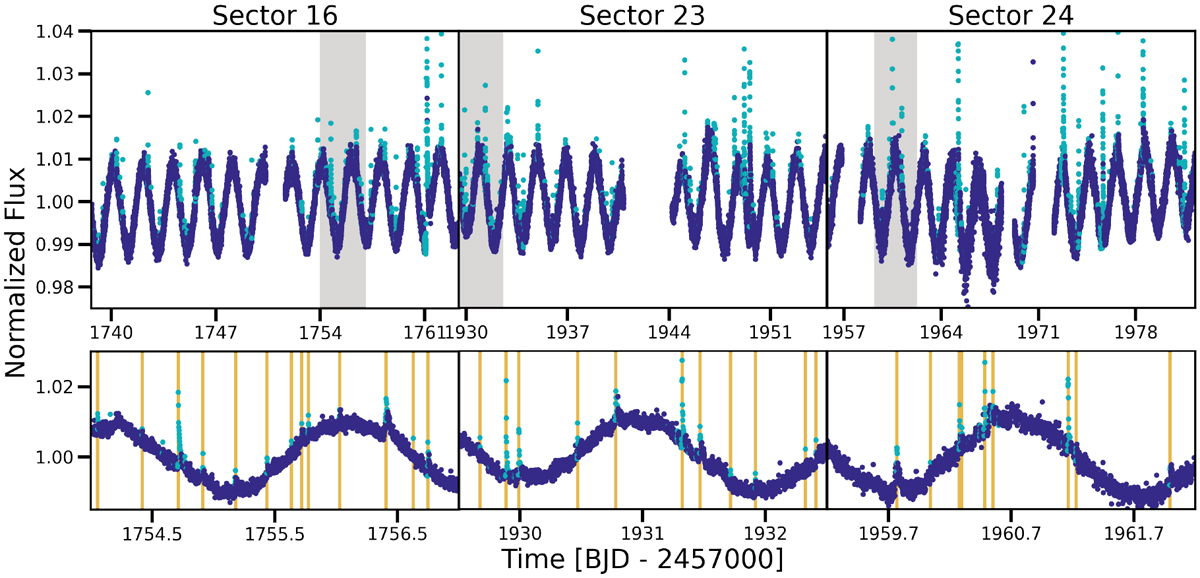
Lightcurves of CR Dra in all three TESS Sectors for which it was observed. Top panels: total lightcurves from each sector. Bottom panels: zoom-in on the shaded regions within each sector. Teal represents cadences with stella-assigned probabilities above our threshold of 0.6; purple represents cadences below this probability. Flares found by stella are marked by the orange vertical lines. The vertical scale has been clipped to better show the rotational variability; the highest amplitude flare is nearly a factor of two in amplitude, as illustrated in Fig. 2.
Current usage metrics show cumulative count of Article Views (full-text article views including HTML views, PDF and ePub downloads, according to the available data) and Abstracts Views on Vision4Press platform.
Data correspond to usage on the plateform after 2015. The current usage metrics is available 48-96 hours after online publication and is updated daily on week days.
Initial download of the metrics may take a while.