Fig. 8
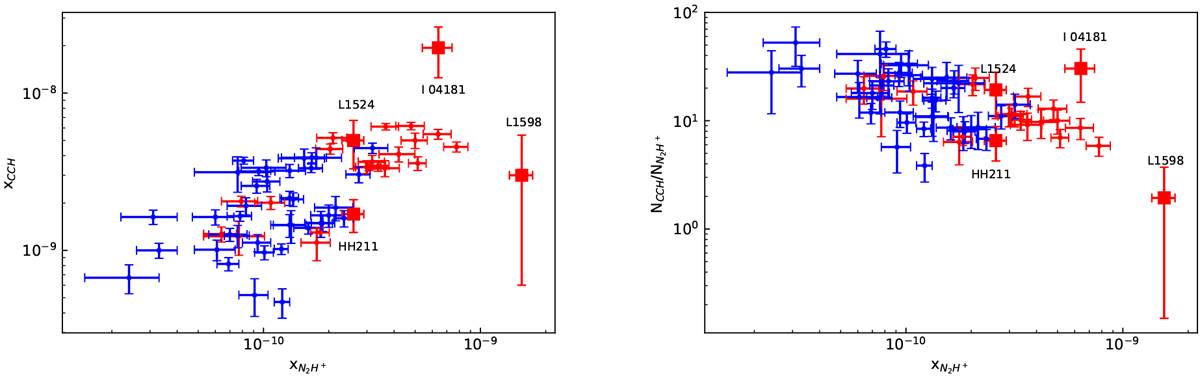
Relationships among x(N2H+), x(CCH), and N(CCH)/N(N2H+). Left: x(N2H+) vs. x(CCH). Right: N(CCH)/N(N2H+) vs. x(N2H+). Sources of I04181, HH211, L1524 and L1598 are marked as red squared data points. The circled data points are obtained from Liu et al. (2019). The circled data points are marked in red or blue according to whether or not they harbor an IRAS source.
Current usage metrics show cumulative count of Article Views (full-text article views including HTML views, PDF and ePub downloads, according to the available data) and Abstracts Views on Vision4Press platform.
Data correspond to usage on the plateform after 2015. The current usage metrics is available 48-96 hours after online publication and is updated daily on week days.
Initial download of the metrics may take a while.