Free Access
Fig. 7
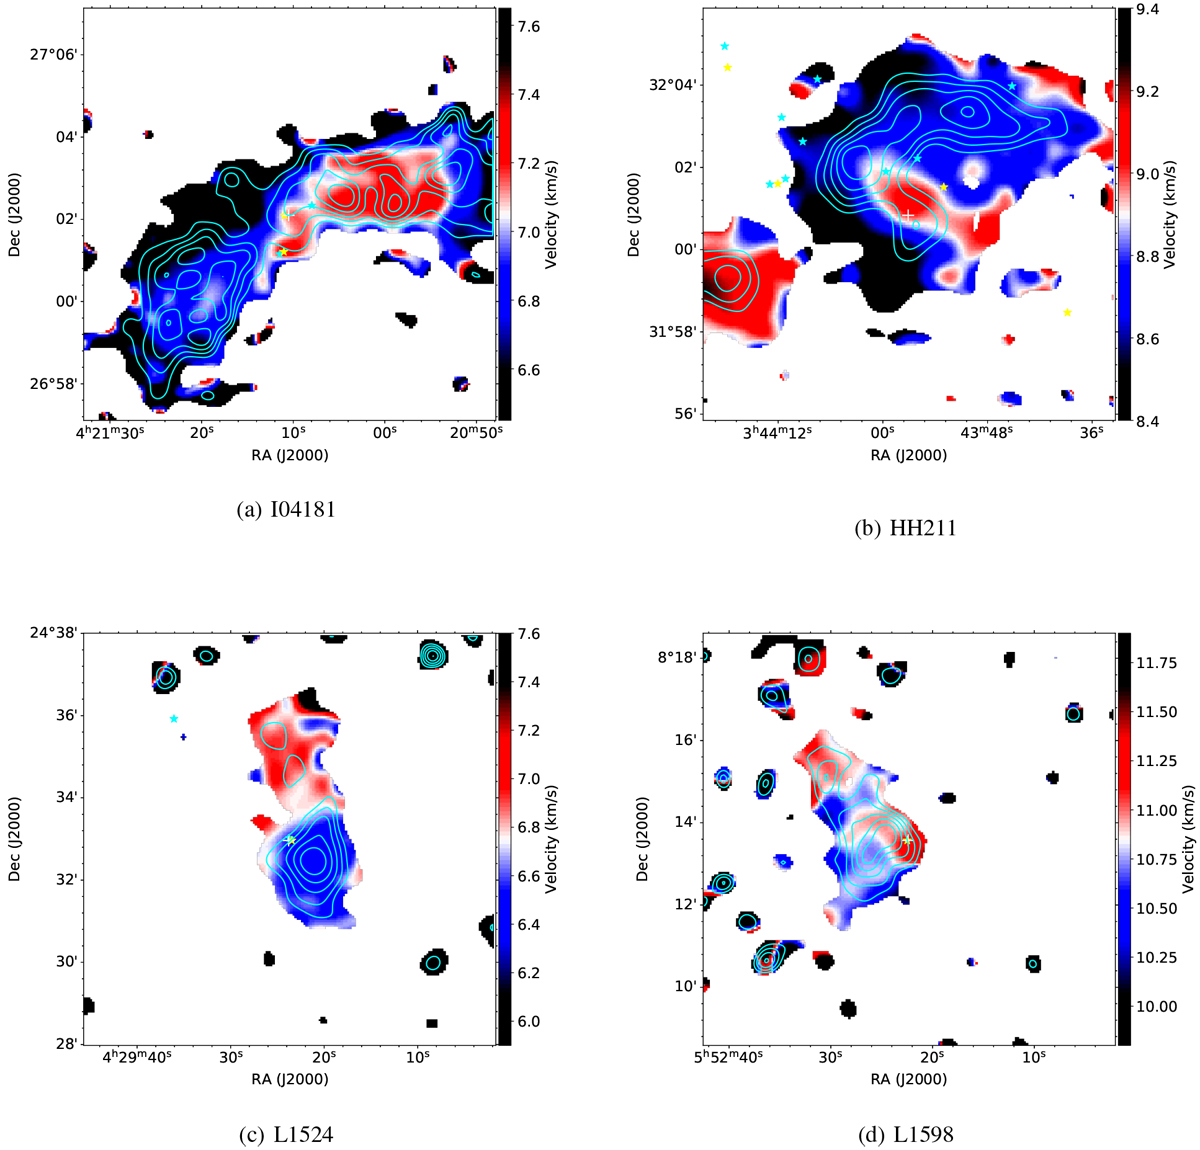
Color image of the first moment maps of HNC (J = 1–0) emission. Contours represent the integrated intensity maps of HNC with contour levels stepped from 50% to 90% by 10% of the peak value. The marker sets are the same as Fig. 5 except the peak positions of ammonia emissions which are not marked.
Current usage metrics show cumulative count of Article Views (full-text article views including HTML views, PDF and ePub downloads, according to the available data) and Abstracts Views on Vision4Press platform.
Data correspond to usage on the plateform after 2015. The current usage metrics is available 48-96 hours after online publication and is updated daily on week days.
Initial download of the metrics may take a while.