Fig. 6
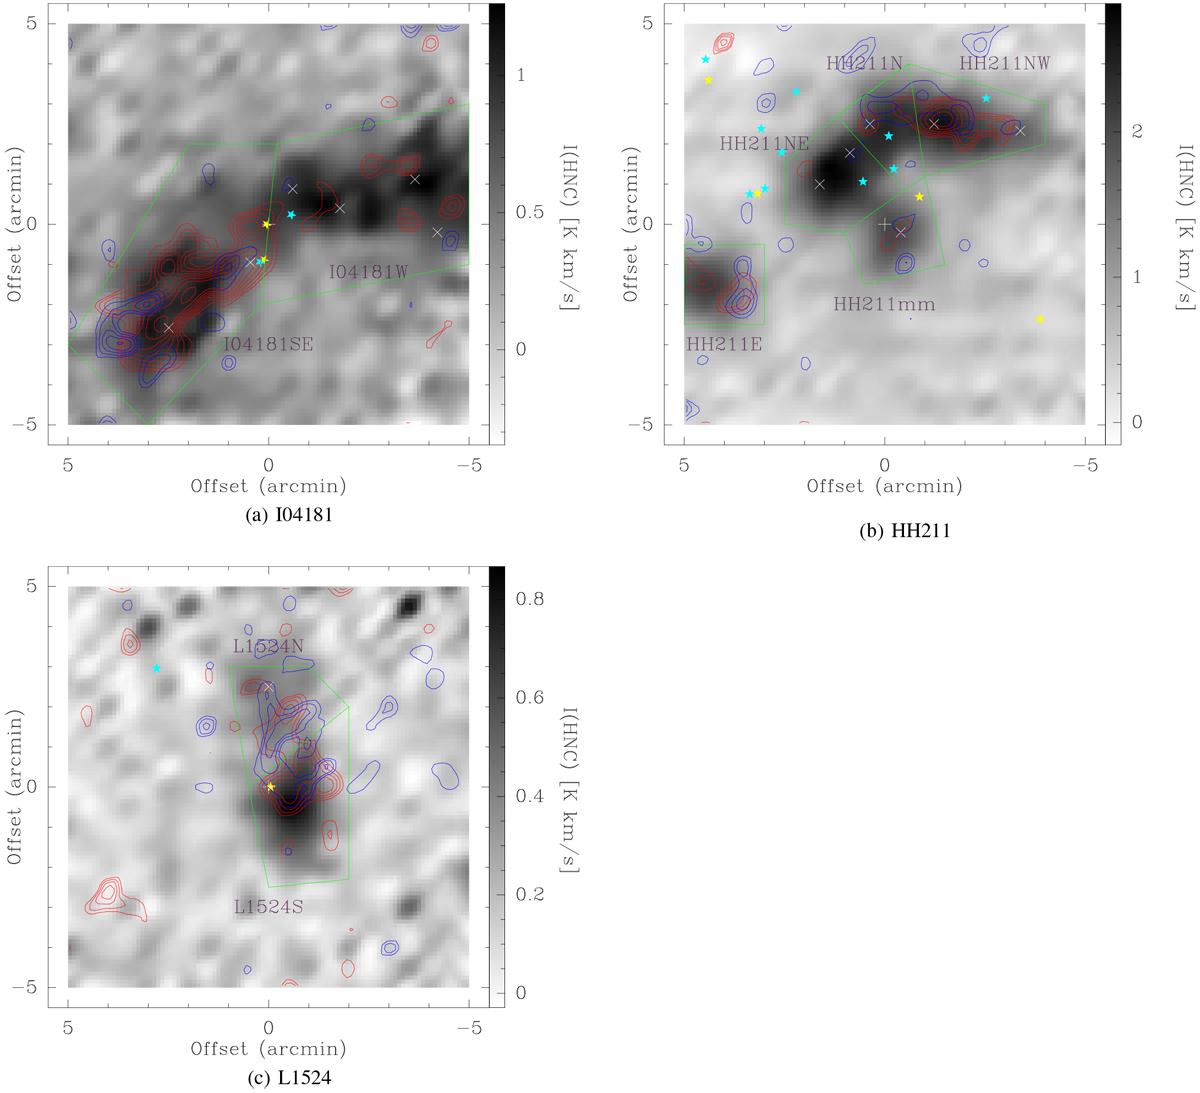
Velocity-integrated intensity maps of HC3N and C4 H. The marker sets and gray scale are the same as Fig. 5. The integrated intensities of HC3 N and C4 H are represented as red and blue contours, respectively, stepped from 5σ to the maximum by 1σ. The 1σ values of HC3N are 0.036 K km s−1 for I04181 and 0.03 K km s−1 for HH211 and L1524. The 1σ value of C4H is 0.05 K km s−1.
Current usage metrics show cumulative count of Article Views (full-text article views including HTML views, PDF and ePub downloads, according to the available data) and Abstracts Views on Vision4Press platform.
Data correspond to usage on the plateform after 2015. The current usage metrics is available 48-96 hours after online publication and is updated daily on week days.
Initial download of the metrics may take a while.