Fig. 5
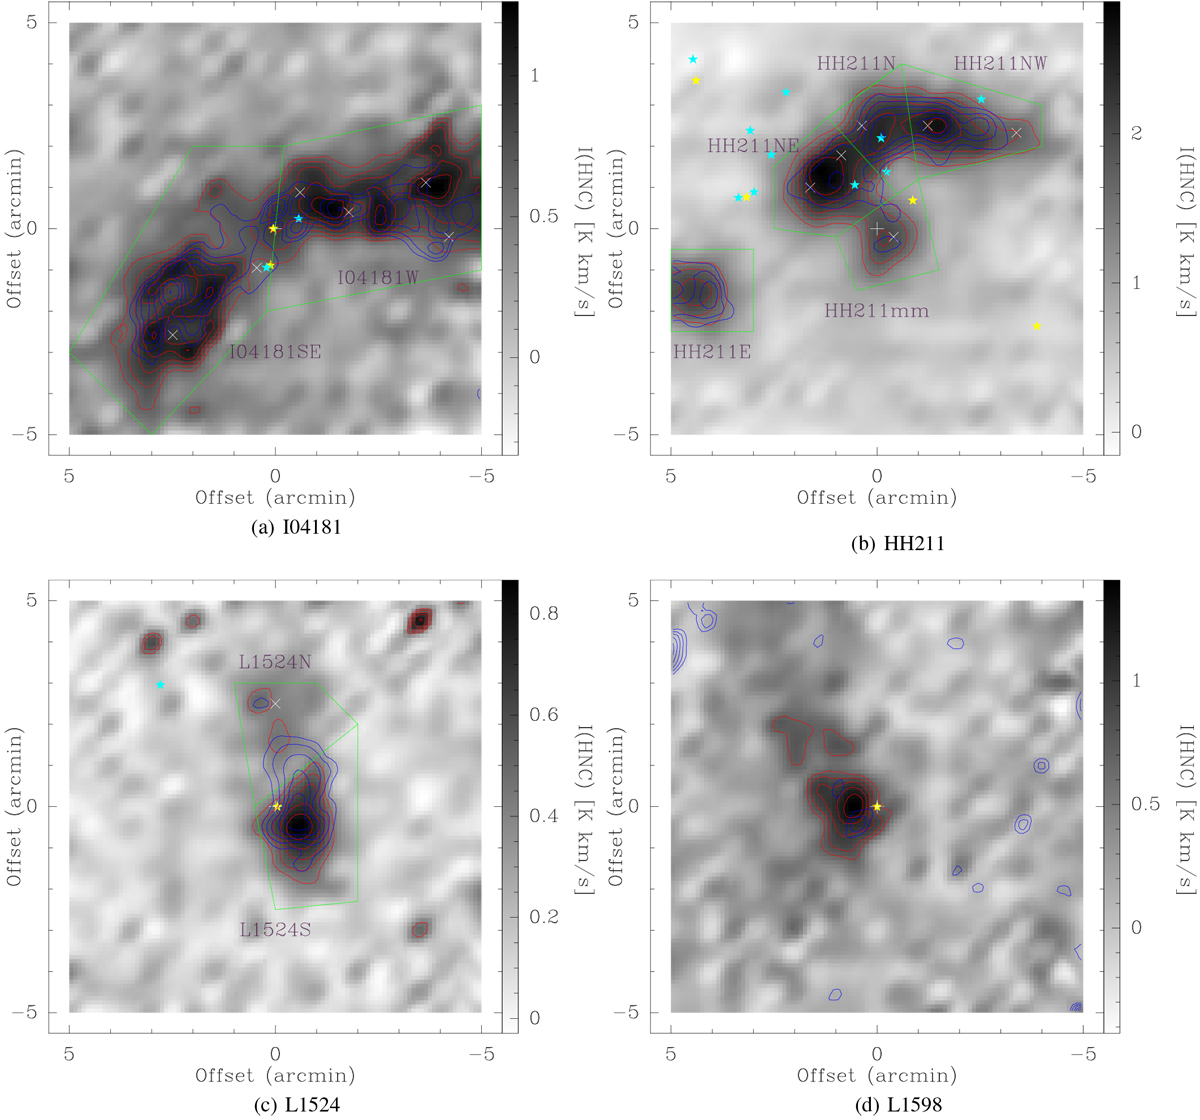
Velocity-integrated intensity maps of HNC and c–C3H2. The integrated intensities of HNC and c–C3H2 are represented as red and blue contours, respectively, stepped from 50% to 90% by 10% of the peak value. The greyscale shows the integrated intensity of HNC. The white cross “+” and “x” are marked as the source coordinates and the peak positions of ammonia emissions obtained from Anglada et al. (1989); Bachiller et al. (1987); Seo et al. (2015). The yellow star and cyan star are marked as IRAS sources and the protostars presented by Helou & Walker (1988); Marton et al. (2016), respectively.
Current usage metrics show cumulative count of Article Views (full-text article views including HTML views, PDF and ePub downloads, according to the available data) and Abstracts Views on Vision4Press platform.
Data correspond to usage on the plateform after 2015. The current usage metrics is available 48-96 hours after online publication and is updated daily on week days.
Initial download of the metrics may take a while.