Free Access
Fig. 2
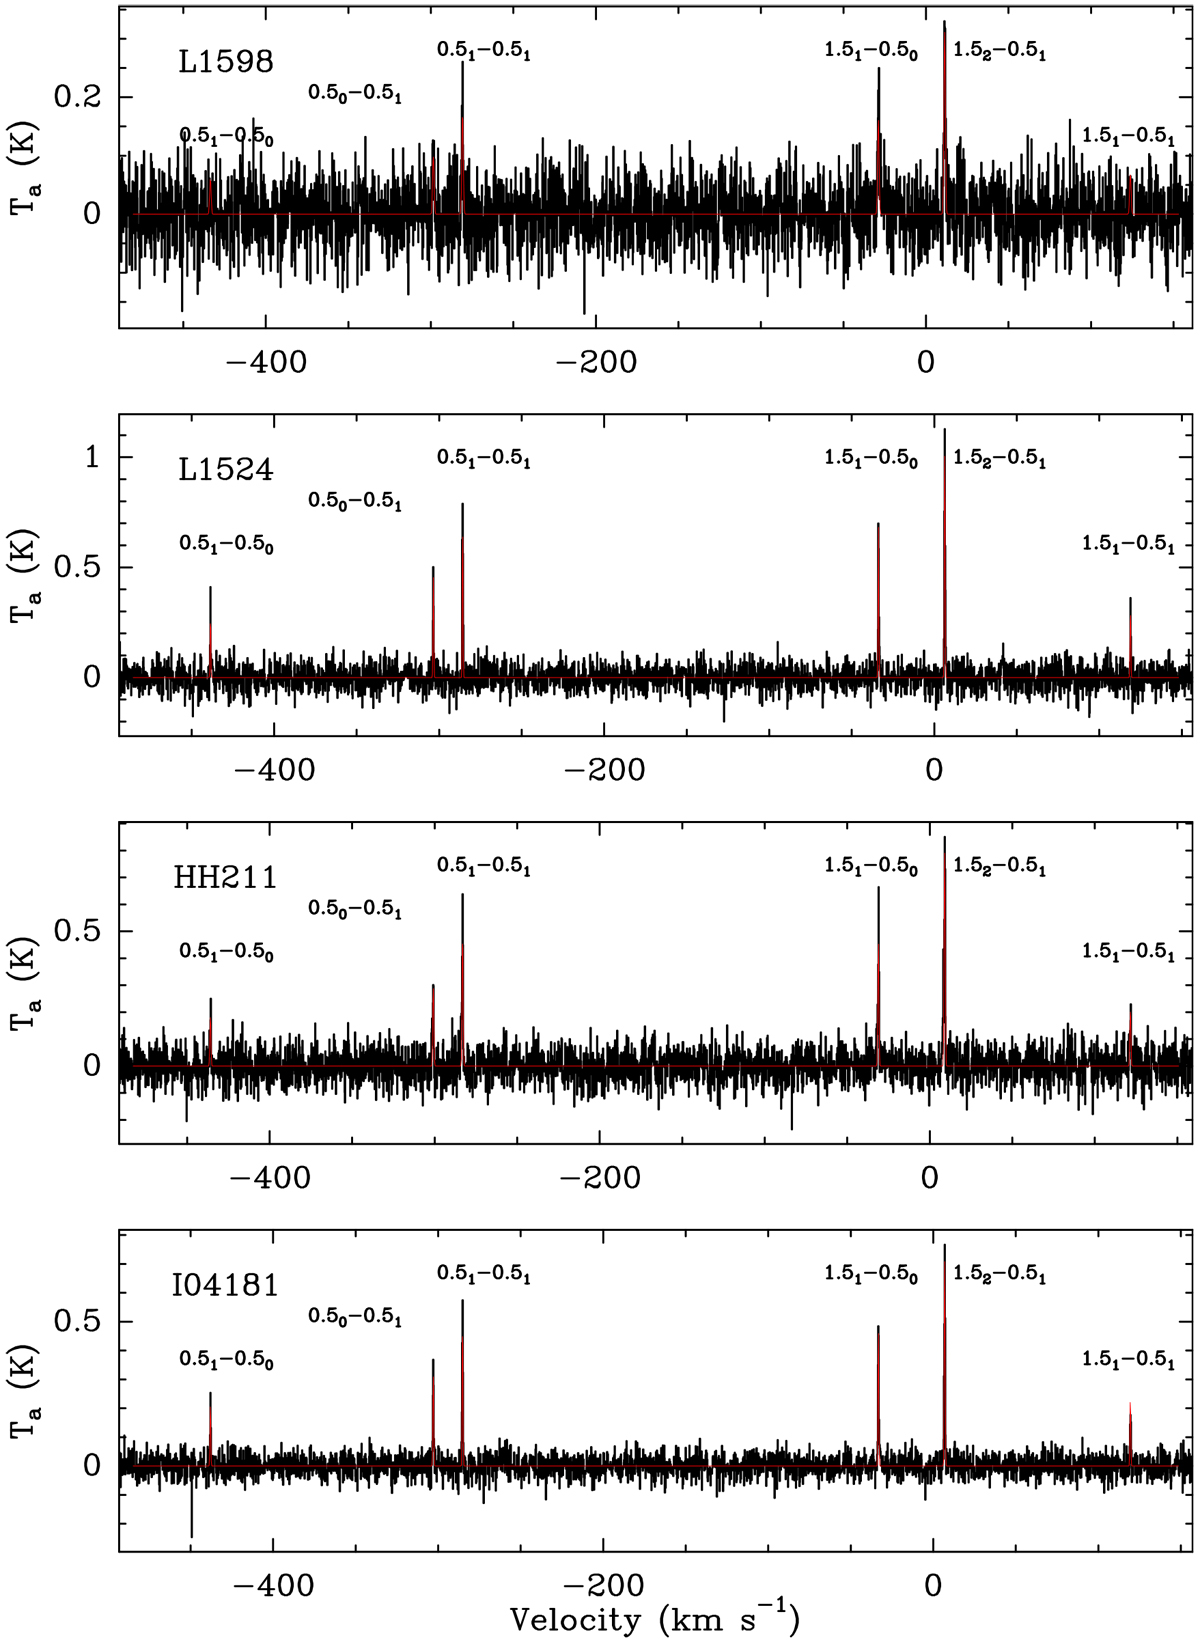
Spectra of CCH (N = 1–0) observed by PMO. The HFS fitting results in color red are overlayed on each spectrum. The source name is labeled at upper left ofspectrum. The hyperfine structures are marked.
Current usage metrics show cumulative count of Article Views (full-text article views including HTML views, PDF and ePub downloads, according to the available data) and Abstracts Views on Vision4Press platform.
Data correspond to usage on the plateform after 2015. The current usage metrics is available 48-96 hours after online publication and is updated daily on week days.
Initial download of the metrics may take a while.