Fig. 6
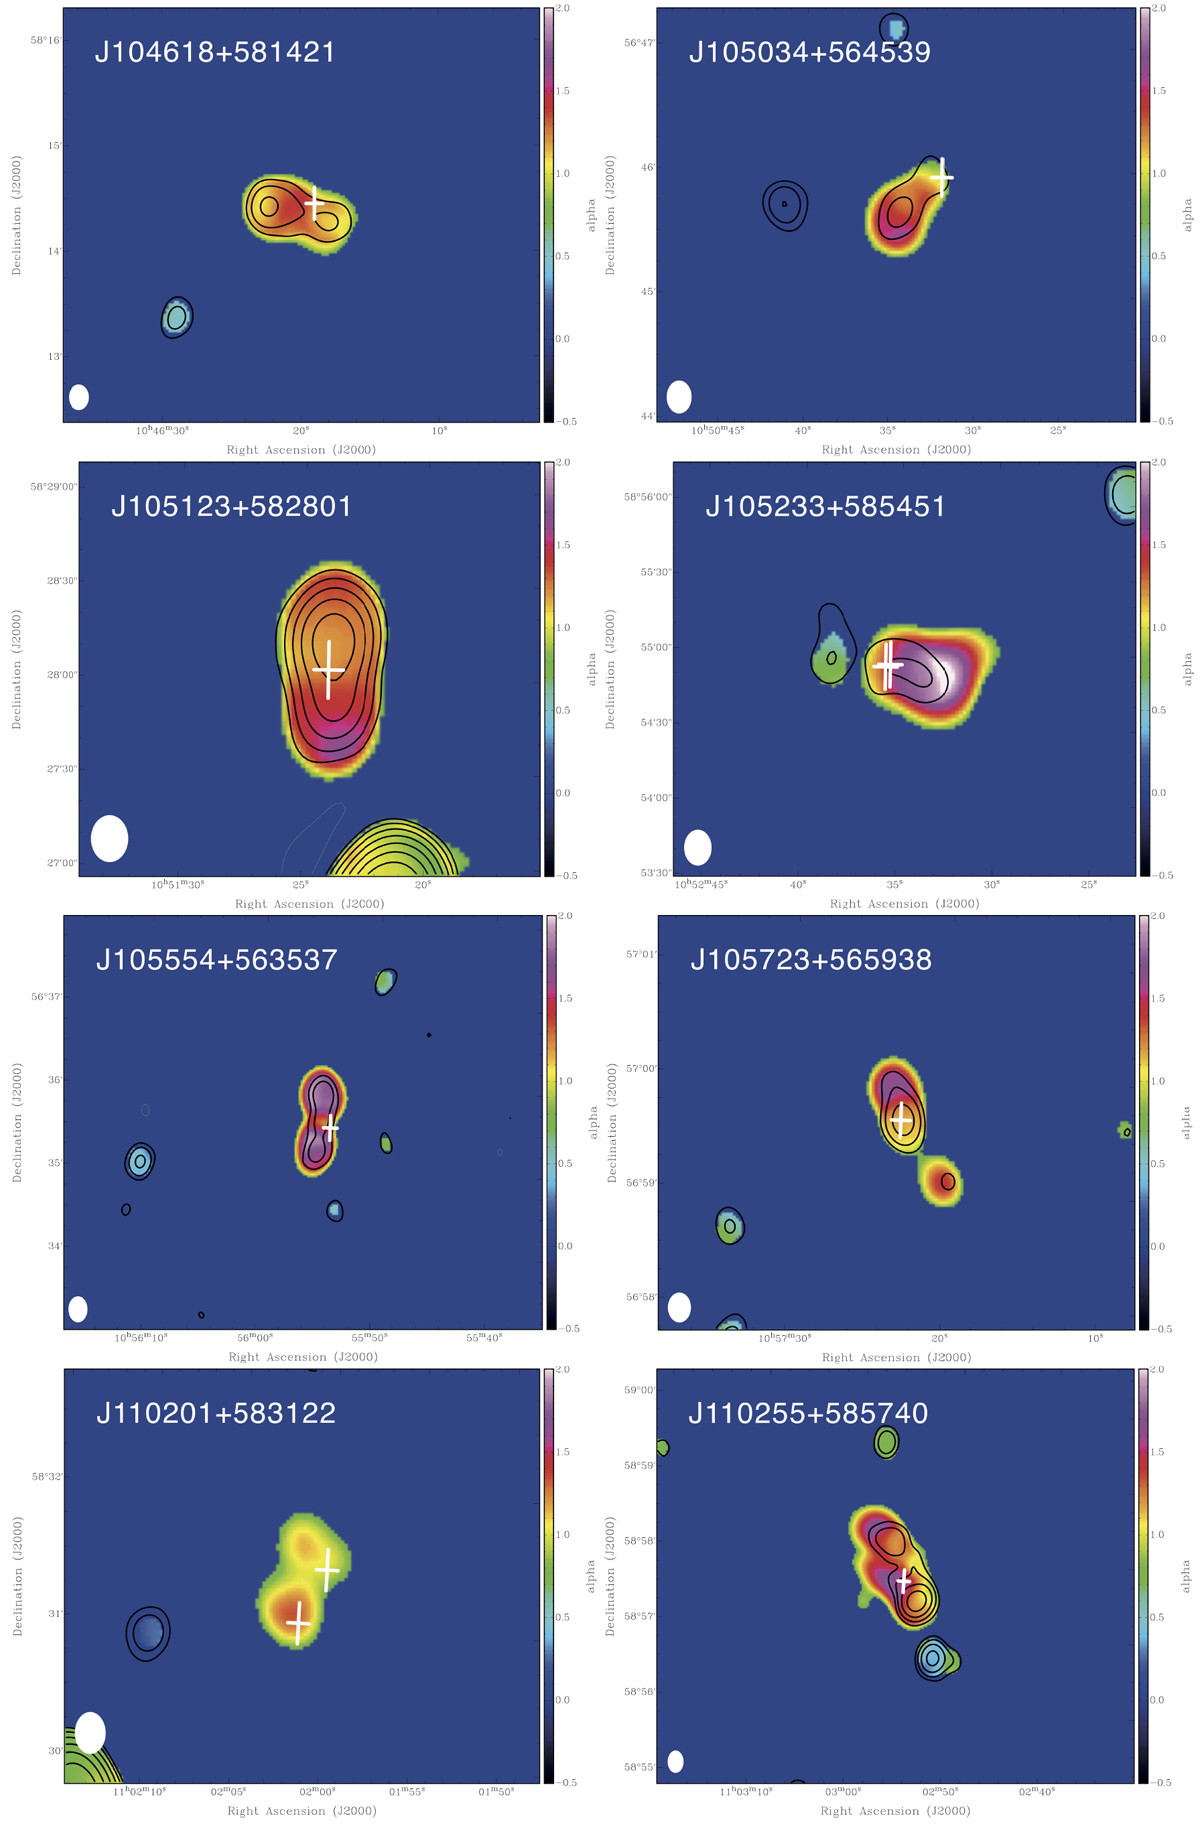
Images of the spectral index and spectral index limits for the sources characterised by USS emission. The contours represent the emission above 5σ at 1.4 GHz (starting at 0.15 mJy beam−1 and increasing with factors of 2). The spectral index inside these contours are detections, while the ones outside are lower limitsto the spectral index (due to the non-detection of Apertif). See the text for details. The beam size is 12′′ × 16′′ and is indicated in the bottom-left corner. The white crosses represent the optical identifications. In two cases, two potential identifications have been found (see also Table 1). The edges around the sources of flatter spectral indices are the results of bias in the way the limits were derived. For more details, see the discussion in Sect. 3.
Current usage metrics show cumulative count of Article Views (full-text article views including HTML views, PDF and ePub downloads, according to the available data) and Abstracts Views on Vision4Press platform.
Data correspond to usage on the plateform after 2015. The current usage metrics is available 48-96 hours after online publication and is updated daily on week days.
Initial download of the metrics may take a while.