Fig. 5
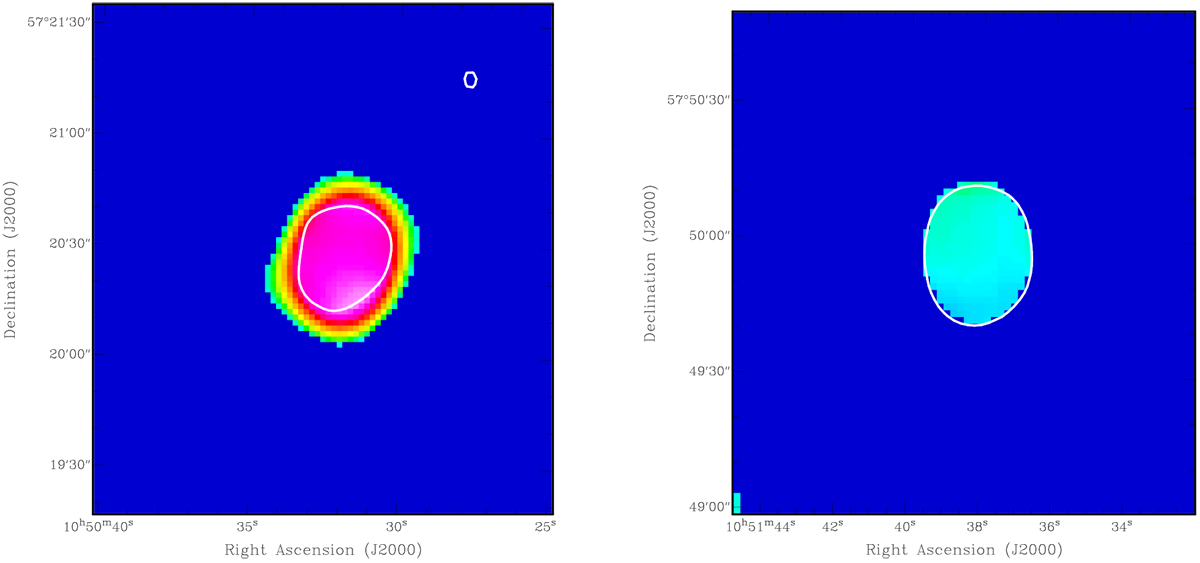
Point sources in the combined spectral image (detection and lower limits) showing the effect of clipping of both the Apertif and LOFAR images at their respective 5σ levels. The white contour shows the extent of the source in the Apertif image at the level of 5σ. Outside this contour, the spectral index represents a lower limit. The point source on the left has a spectral index of 0.9, causing the source to be brighter in terms of S/N in the LOFAR image, and, therefore, the region above 5σ in the LOFAR image is larger than in the Apertif image. This creates an artificial region with a lower limit. The right-hand source has a spectral index of 0.54, which is close to the spectral index of 0.58 that corresponds to the noise levels in both images, so that the source has the same S/N in both images and no region with lower limits is created.
Current usage metrics show cumulative count of Article Views (full-text article views including HTML views, PDF and ePub downloads, according to the available data) and Abstracts Views on Vision4Press platform.
Data correspond to usage on the plateform after 2015. The current usage metrics is available 48-96 hours after online publication and is updated daily on week days.
Initial download of the metrics may take a while.