Fig. 4
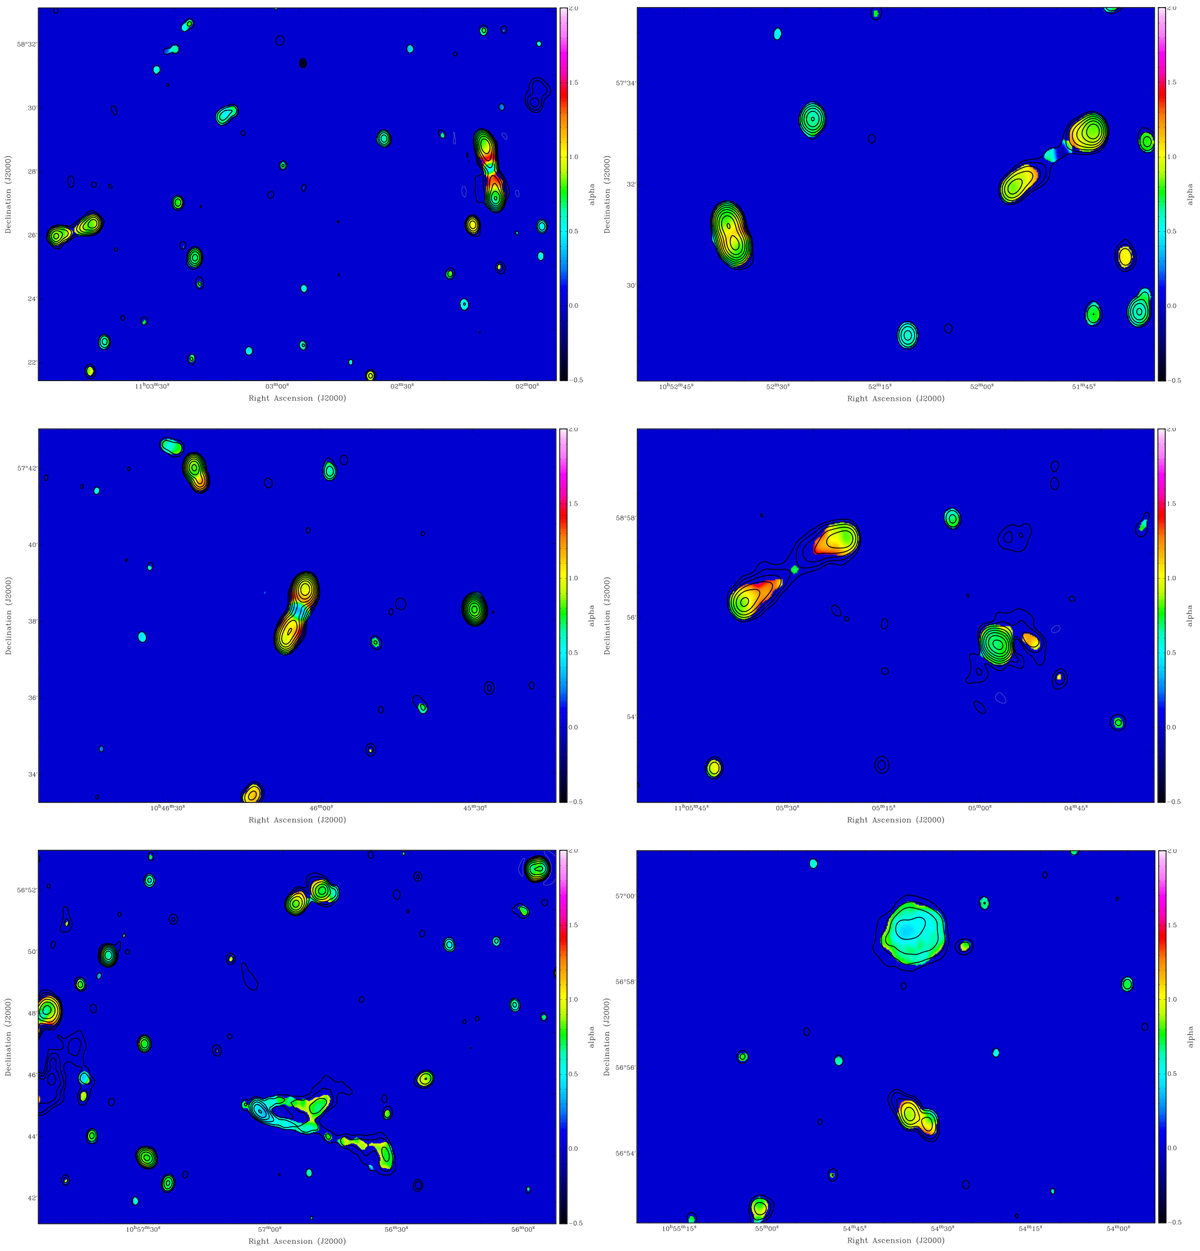
Examples of images of the spectral index ![]() in various regions of the large Apertif-LOFAR image. The variety of spectral structures is evident. A few double-lobed radio galaxies showing the classical spectral structure are seen, while the emission from a star forming galaxy and from a cluster object is also present. Spectral indices commonly found in active radio galaxies (i.e.
0.5 ≲ α ≲ 1, see e.g. de Gasperin et al. 2018; Mahony et al. 2016 and references therein) are indicated by the light green to yellow colours. Flat or inverted spectra (α ≲ 0.5) are indicated in blue and light blue. Extremely steep spectrum and USS values are indicated in red and pink. The contours represent the LOFAR emission, and contour levels are from −0.55, 0.55 mJy beam−1 (5σ) increasing in steps of 2. Negative contours are shown in grey.
in various regions of the large Apertif-LOFAR image. The variety of spectral structures is evident. A few double-lobed radio galaxies showing the classical spectral structure are seen, while the emission from a star forming galaxy and from a cluster object is also present. Spectral indices commonly found in active radio galaxies (i.e.
0.5 ≲ α ≲ 1, see e.g. de Gasperin et al. 2018; Mahony et al. 2016 and references therein) are indicated by the light green to yellow colours. Flat or inverted spectra (α ≲ 0.5) are indicated in blue and light blue. Extremely steep spectrum and USS values are indicated in red and pink. The contours represent the LOFAR emission, and contour levels are from −0.55, 0.55 mJy beam−1 (5σ) increasing in steps of 2. Negative contours are shown in grey.
Current usage metrics show cumulative count of Article Views (full-text article views including HTML views, PDF and ePub downloads, according to the available data) and Abstracts Views on Vision4Press platform.
Data correspond to usage on the plateform after 2015. The current usage metrics is available 48-96 hours after online publication and is updated daily on week days.
Initial download of the metrics may take a while.