Free Access
Fig. 3
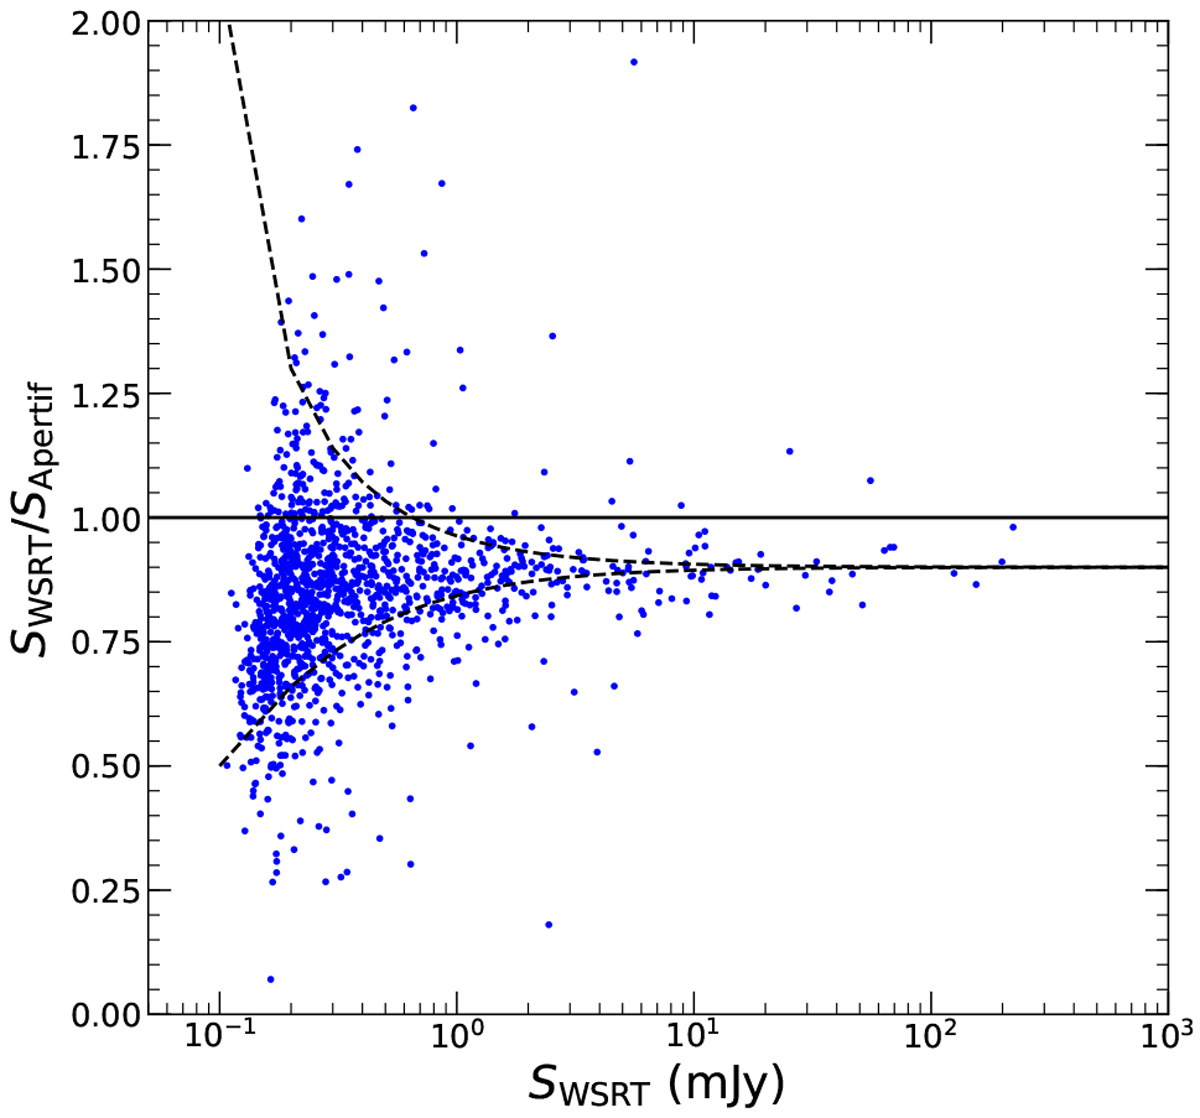
Distribution of the flux ratio of sources in the old WSRT image and the new Apertif image. An offset of 10% in the Apertif flux scale is indicated and has been corrected for in the analysis (see text for details). The dashed lines indicate the expected spread due to an error in the flux densities of 1σ.
Current usage metrics show cumulative count of Article Views (full-text article views including HTML views, PDF and ePub downloads, according to the available data) and Abstracts Views on Vision4Press platform.
Data correspond to usage on the plateform after 2015. The current usage metrics is available 48-96 hours after online publication and is updated daily on week days.
Initial download of the metrics may take a while.