Fig. C.2
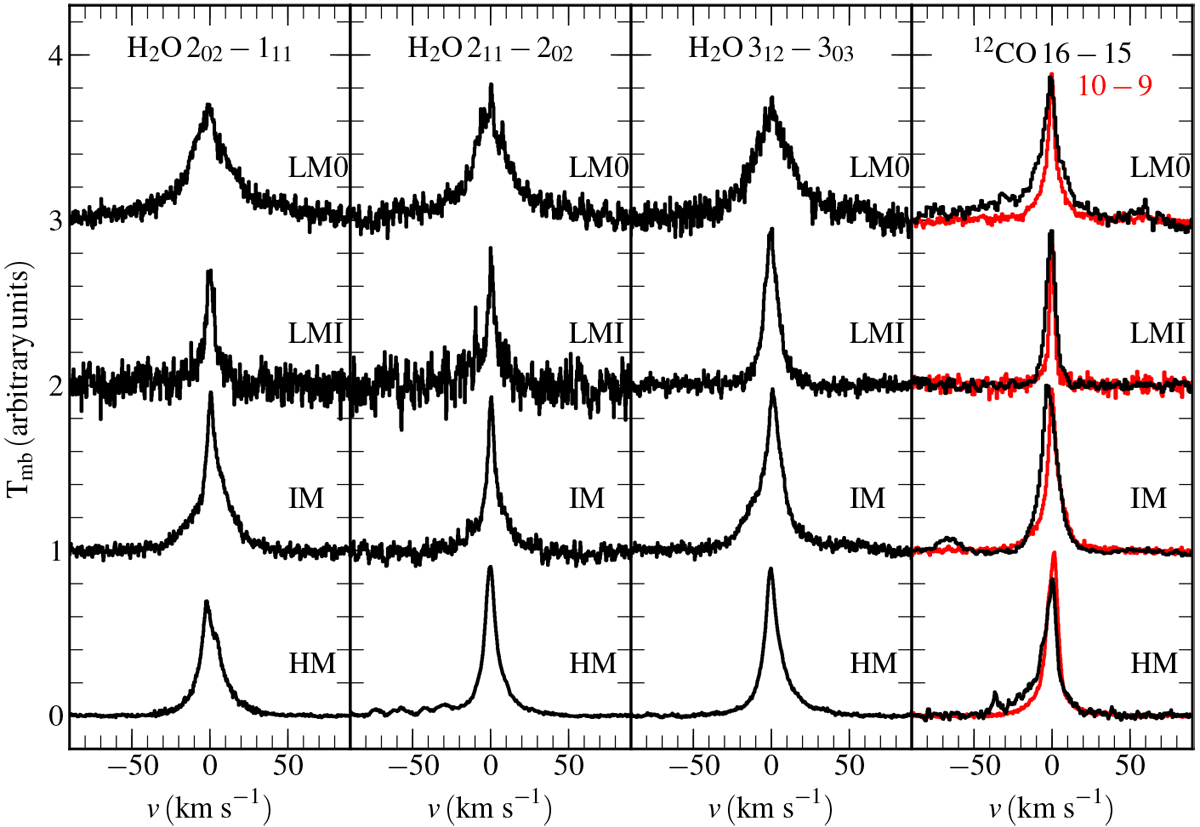
Averaged and normalized mid-J water and CO spectra for low-mass Class 0 (LM0), low-mass Class I (LMI), intermediate mass (IM) and high mass (HM) sources. From left to right the H2O 202 − 111 line at 988 GHz, 211−202 line at 752 GHz, the 312−303 line at 1097 GHz, and the CO J = 16–15 together with the 10–9 profiles are presented. All spectra have been shifted to zero velocity. The low intensity features on the blue wing of the 752 GHz HM spectrum are due to methanol emission. Data from San José-García et al. (2013, 2016); Kristensen et al. (2017b)
Current usage metrics show cumulative count of Article Views (full-text article views including HTML views, PDF and ePub downloads, according to the available data) and Abstracts Views on Vision4Press platform.
Data correspond to usage on the plateform after 2015. The current usage metrics is available 48-96 hours after online publication and is updated daily on week days.
Initial download of the metrics may take a while.