Fig. 22
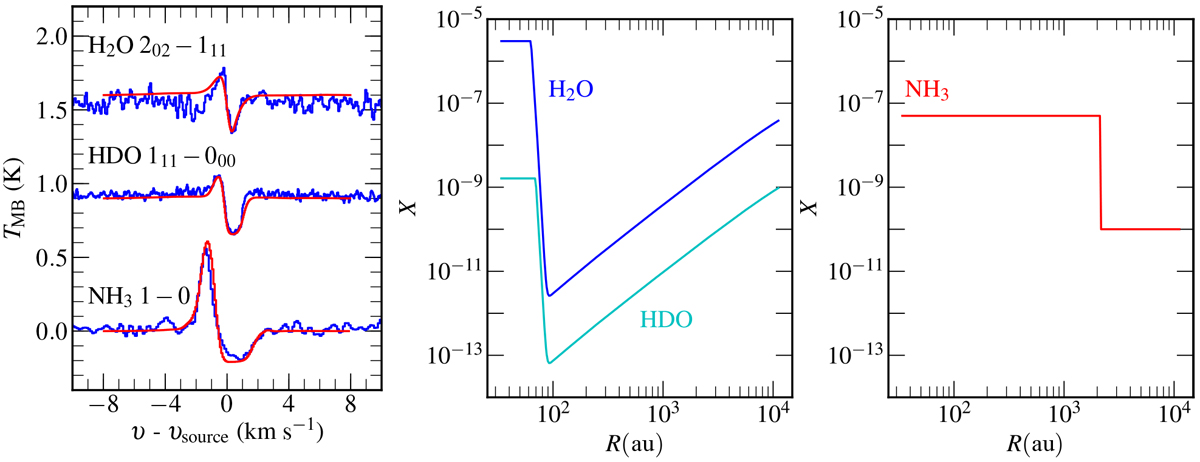
Left: outflow-subtracted HIFI line profiles of H2O, HDO and NH3 (blue) toward the low-mass protostar NGC 1333 IRAS 4A overlaid with the best fit model line profiles (red). These model spectra correspond to the abundance structures presented in the middle and right panels. The inner H2O and HDO abundances are set to those found by Persson et al. (2014, 2016).
Current usage metrics show cumulative count of Article Views (full-text article views including HTML views, PDF and ePub downloads, according to the available data) and Abstracts Views on Vision4Press platform.
Data correspond to usage on the plateform after 2015. The current usage metrics is available 48-96 hours after online publication and is updated daily on week days.
Initial download of the metrics may take a while.