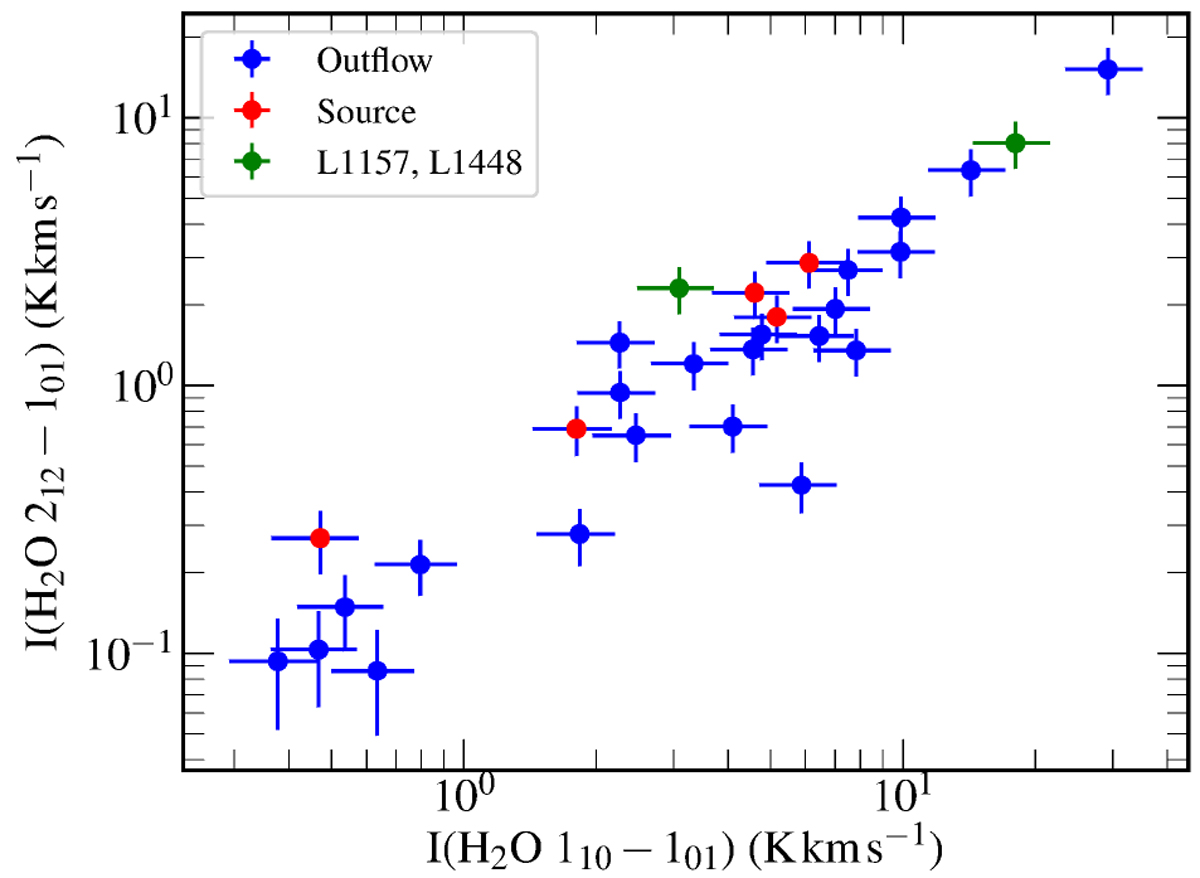
Fig. 13

Correlation of the water 110−101 557 GHz (HIFI) and 212−101 1670 GHz/179 μm (PACS) line intensities convolved to a common angular resolution toward various outflow and source positions. The outflow data points (blue) are from Tafalla et al. (2013), whereas the source positions (red) use data from Kristensen et al. (2012). This figure demonstrates similar line ratios and thus similar conditions at the on and off source positions. Also, the two sources with strong EHV components, L1157 and L1448-MM (green), do not stand out in this figure.
Current usage metrics show cumulative count of Article Views (full-text article views including HTML views, PDF and ePub downloads, according to the available data) and Abstracts Views on Vision4Press platform.
Data correspond to usage on the plateform after 2015. The current usage metrics is available 48-96 hours after online publication and is updated daily on week days.
Initial download of the metrics may take a while.


