Fig. 2.
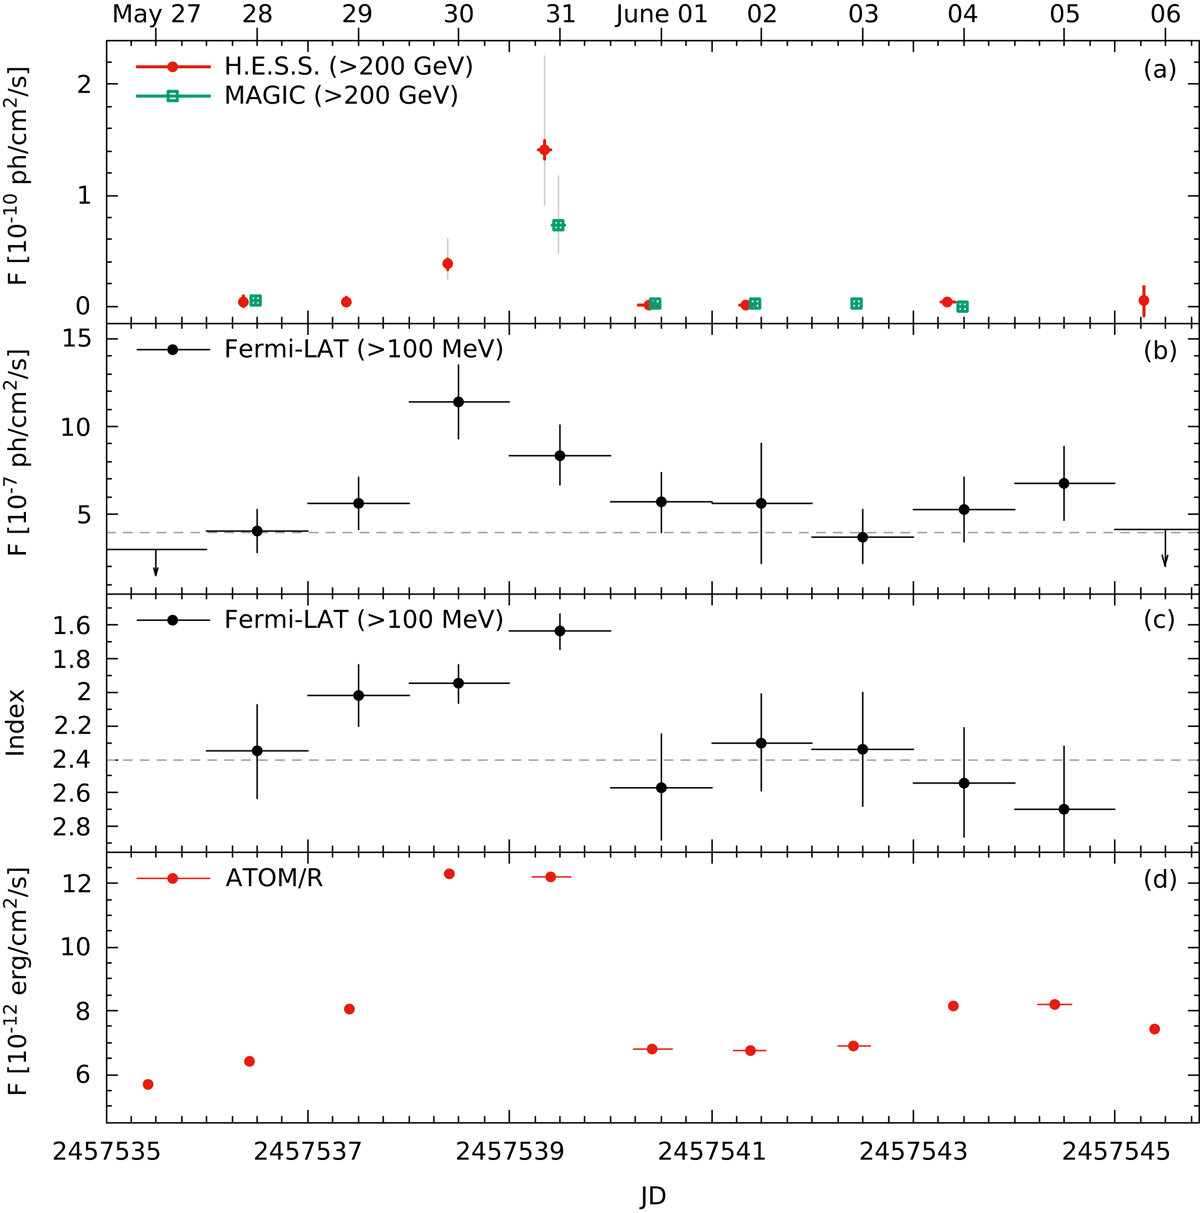
Light curves of PKS 1510–089 during the observation period. a: nightly averaged VHE γ-ray light curve from H.E.S.S. (red points) and MAGIC (green open squares). The grey bars mark the systematic uncertainties. b: 24 h-average HE γ-ray light curve from Fermi-LAT. The dashed line marks the 11 years average with F̅ = 3.92 × 10⁻⁷ ph cm−2 s−1. Arrows mark 95% CL upper limits for bins with test statistics (TS) < 9.0. c: 24 h-binned HE γ-ray spectral index assuming a power-law spectrum. The dashed line marks the 11-year average with the index = 2.402. d: nightly averaged optical R-band light curve (de-reddened) from ATOM. The horizontal bars mark the observation time.
Current usage metrics show cumulative count of Article Views (full-text article views including HTML views, PDF and ePub downloads, according to the available data) and Abstracts Views on Vision4Press platform.
Data correspond to usage on the plateform after 2015. The current usage metrics is available 48-96 hours after online publication and is updated daily on week days.
Initial download of the metrics may take a while.