Fig. 6
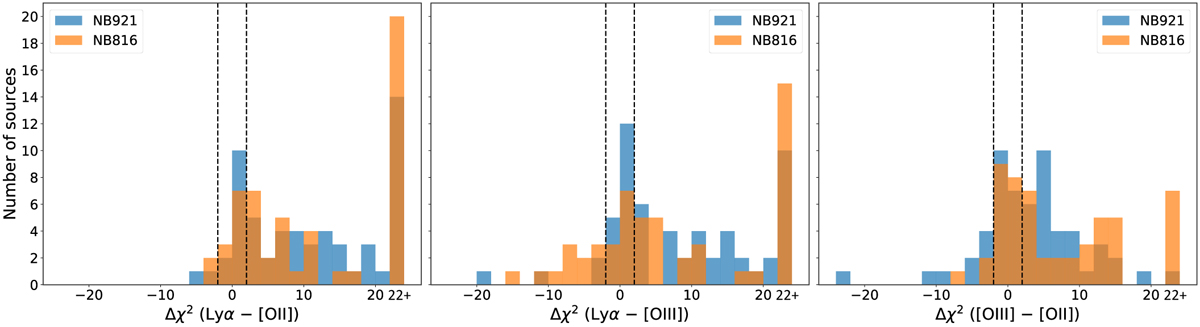
Comparison of χ2 values obtained from SED fitting models of Lyα, [OII], and [OIII] for the optical cross-matched LAE sample of NB921 and NB816. The dashed lines indicate Δχ2 values of 2 and − 2. For values higher than 2 and lower than −2, there is a preferred model, but in between the dashed lines there is no preference for either model. The bin width is set to 2.
Current usage metrics show cumulative count of Article Views (full-text article views including HTML views, PDF and ePub downloads, according to the available data) and Abstracts Views on Vision4Press platform.
Data correspond to usage on the plateform after 2015. The current usage metrics is available 48-96 hours after online publication and is updated daily on week days.
Initial download of the metrics may take a while.