Fig. 5
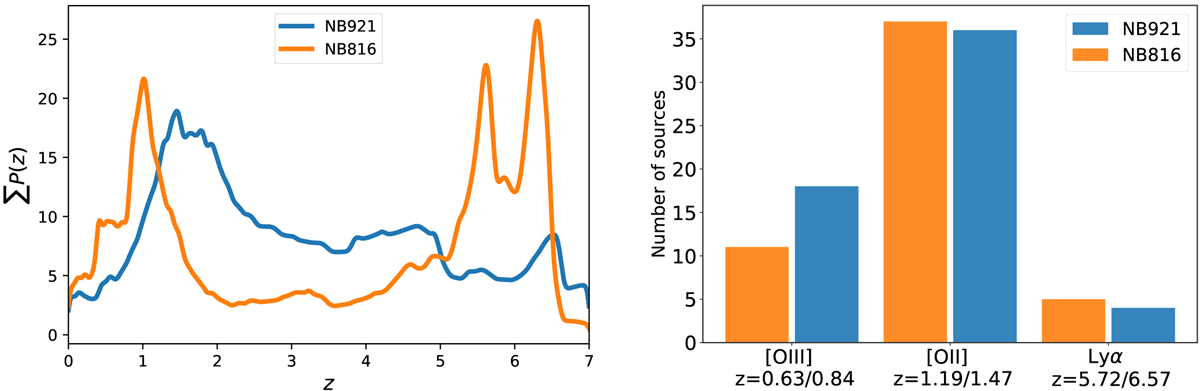
Left: stacked photometric redshift probability distribution (sum of individual sources) of the optically cross-matched sample of the NB921 and NB816 LAE catalogues from D20. Right: histograms of the best-fitting solutions for SED fits performed with fixed-redshift solutions corresponding to the three candidate emission lines. The known possible redshifts from the NB emission line detections and more detailed SED fitting allows us to exclude other high-z solutions that are sometimes favoured by the photometric redshift code.
Current usage metrics show cumulative count of Article Views (full-text article views including HTML views, PDF and ePub downloads, according to the available data) and Abstracts Views on Vision4Press platform.
Data correspond to usage on the plateform after 2015. The current usage metrics is available 48-96 hours after online publication and is updated daily on week days.
Initial download of the metrics may take a while.