Free Access
Fig. 2
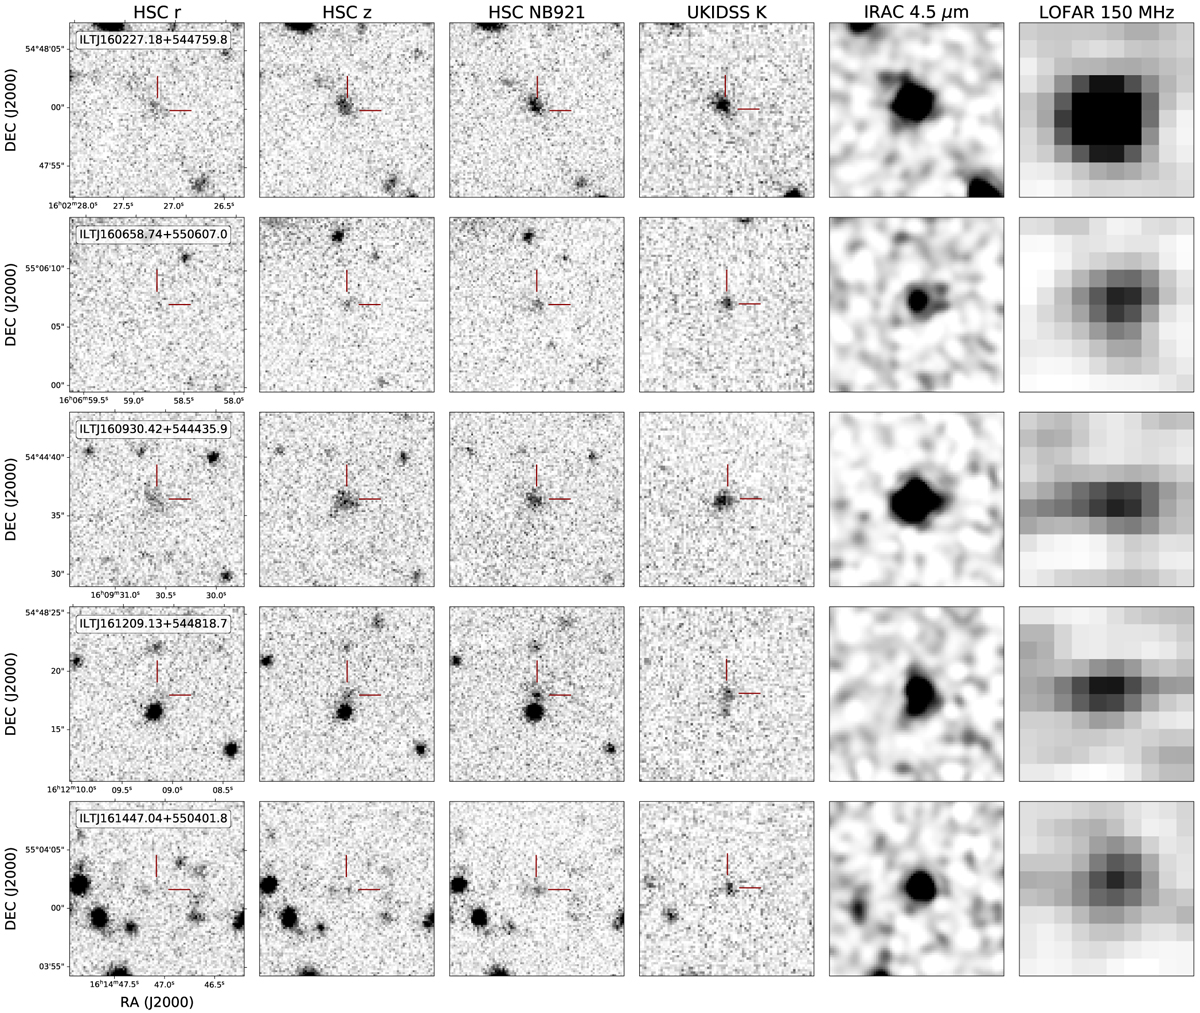
Multi-wavelength cutouts of the LOFAR-detected sample including, from left to right: HSC r band, HSC z band, HSC NB921 band, UKIDSS K band, IRAC 4.5 μm, and LOFAR 150 MHz. The sources show negligible or no emission below the Lyman break in the r band; however, clear emission is seen in both the UKIDSS K band and IRAC.
Current usage metrics show cumulative count of Article Views (full-text article views including HTML views, PDF and ePub downloads, according to the available data) and Abstracts Views on Vision4Press platform.
Data correspond to usage on the plateform after 2015. The current usage metrics is available 48-96 hours after online publication and is updated daily on week days.
Initial download of the metrics may take a while.