Fig. 2
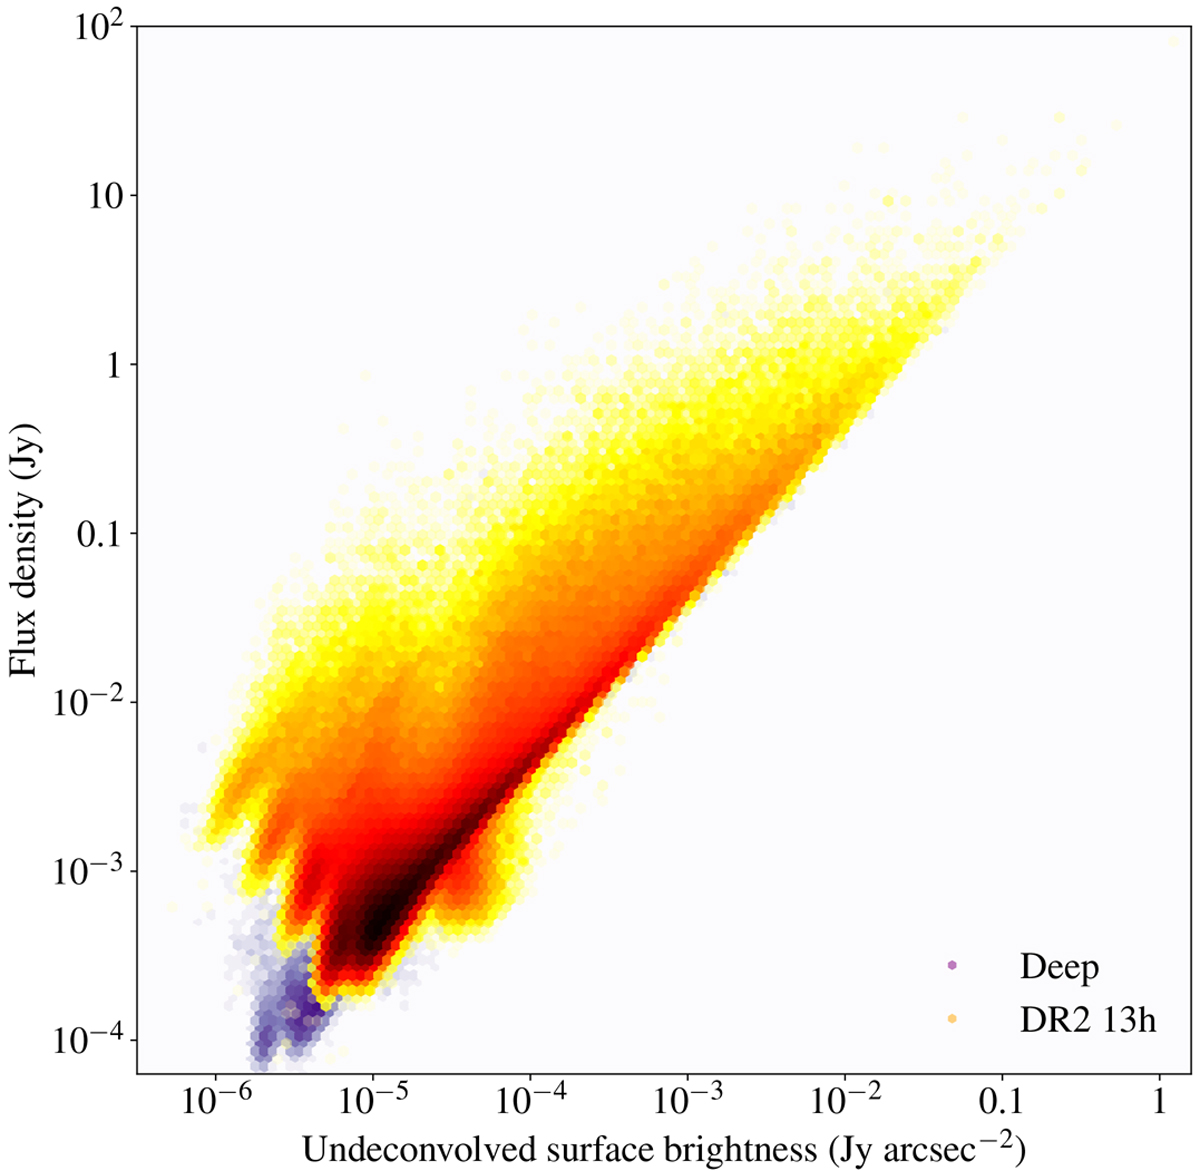
Total flux density against a proxy of mean surface brightness for the wide and deep fields. Red/yellow colours show a density plot for the 13-h field; purples, below, show the same plot for the combination of the three deep fields described in the text. The boundary at the lower right-hand edge corresponds to unresolved sources, and at the left-hand edge to the surface brightness limit.
Current usage metrics show cumulative count of Article Views (full-text article views including HTML views, PDF and ePub downloads, according to the available data) and Abstracts Views on Vision4Press platform.
Data correspond to usage on the plateform after 2015. The current usage metrics is available 48-96 hours after online publication and is updated daily on week days.
Initial download of the metrics may take a while.