Fig. 1
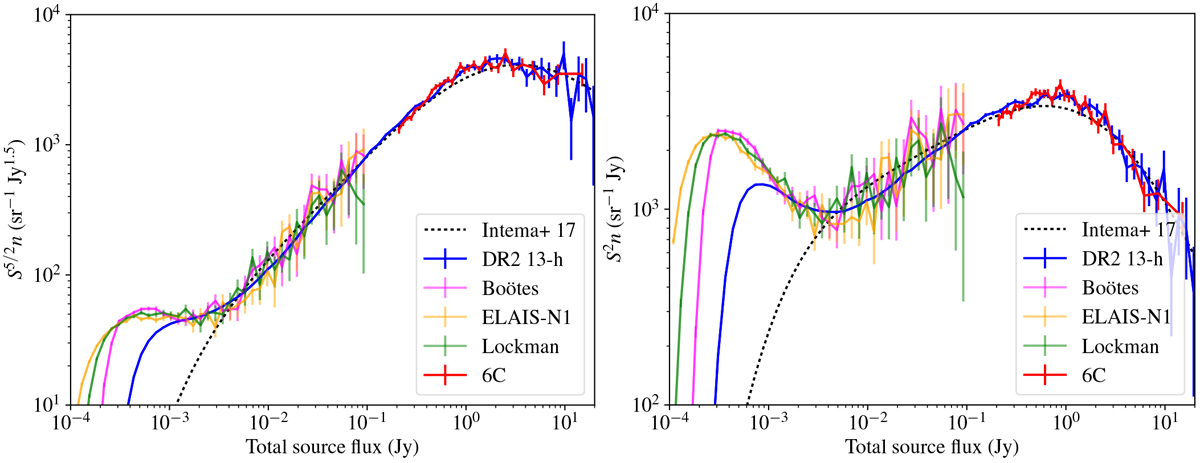
Uncorrected source counts for the DR2 13-h field and the three LoTSS deep fields. Poissonian error bars are plotted. Left panel: conventional Euclidean scaling of the differential source counts, S5∕2 ; right panel: scaling by S2 which emphasises the contribution made by each bin to the integrated total flux density per unit area. Overplotted are the 6C source counts of Hales et al. (1988) and the functional form fitted by Intema et al. (2017) to the combined TGSS and literature source counts.
Current usage metrics show cumulative count of Article Views (full-text article views including HTML views, PDF and ePub downloads, according to the available data) and Abstracts Views on Vision4Press platform.
Data correspond to usage on the plateform after 2015. The current usage metrics is available 48-96 hours after online publication and is updated daily on week days.
Initial download of the metrics may take a while.