Fig. 9
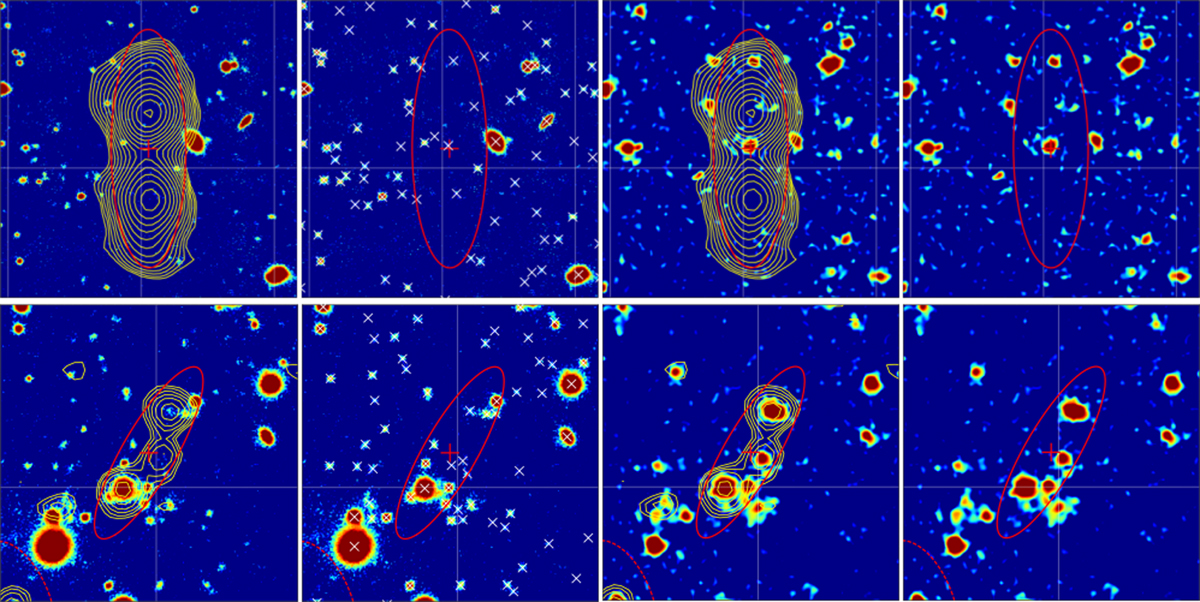
Example set of images used for visual classification of two sources (in rows) using LOFAR Galaxy Zoo (LGZ). The radio source to be classified is in the red ellipse with its PYBDSF radio position marked by a red cross. First frame: optical image with radio contours overlaid. Second frame: same optical image now without the radio contours, but with white crosses to mark multi-wavelength catalogue detections. Third frame: 4.5 μm image with radio contours overlaid. Fourth frame: same 4.5 μm image but without radio contours to aid in host galaxy identification. Top: an example of a large radio source. Bottom: an example of a blended radio source initially sent to LGZ, where the radio emission (contours) arises from three distinct physical sources that have been incorrectly grouped together into one PYBDSF source (red ellipse). This source was flagged as a blend during the LGZ process by the majority of volunteers and was appropriately sent to the expert-user workflow forde-blending.
Current usage metrics show cumulative count of Article Views (full-text article views including HTML views, PDF and ePub downloads, according to the available data) and Abstracts Views on Vision4Press platform.
Data correspond to usage on the plateform after 2015. The current usage metrics is available 48-96 hours after online publication and is updated daily on week days.
Initial download of the metrics may take a while.