Fig. 8
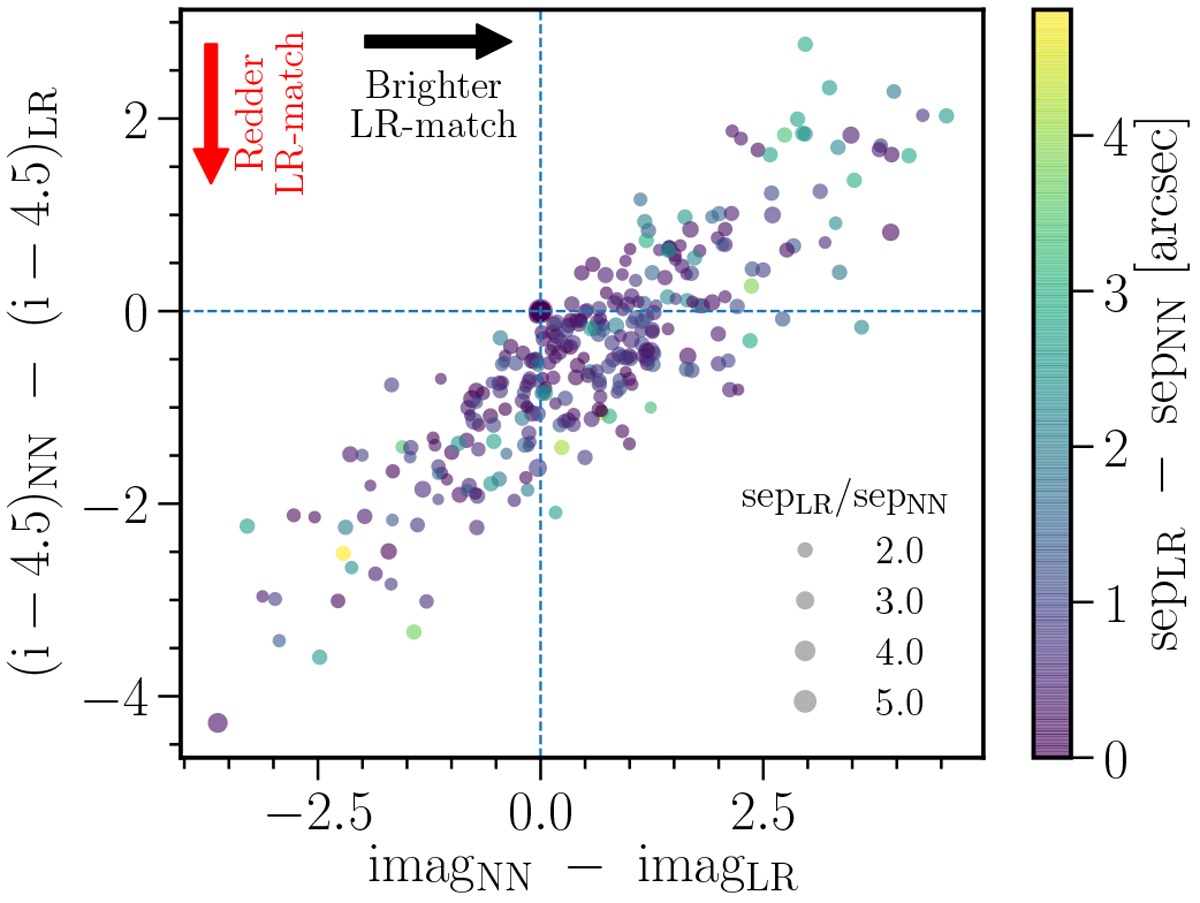
Comparison between the LR method and a simple NN cross-match for radio sources selected by the decision tree to accept the LR-ID in ELAIS-N1. The plot shows colour (i - 4.5 μm) difference versus i-band magnitude difference between a NN search and the LR method. Negative y-axis values correspond to a redder LR match compared to the NN match, and positive x-axis values correspond to a brighter LR match, as indicated by the arrows. For the vast majority (≈98%) of the radio sources used for this comparison (see Sect. 4.2.4), the LR match and the NN match are the same (indicated by the large point at (0,0)). The offset from the origin shows that, where these differ, the LR method preferentially selects sources which are either redder or brighter (or both) than the NN match. The colour of the points corresponds to the difference in separation between the LR match and the NN match (sepLR−sepNN). The size of the points corresponds to the ratio of the separations between the LR method and the NN match (i.e. larger points indicate larger ratios; see plot legend). For radio sources where the LR match is different to the NN match, the separation to the two sources are similar.
Current usage metrics show cumulative count of Article Views (full-text article views including HTML views, PDF and ePub downloads, according to the available data) and Abstracts Views on Vision4Press platform.
Data correspond to usage on the plateform after 2015. The current usage metrics is available 48-96 hours after online publication and is updated daily on week days.
Initial download of the metrics may take a while.