Fig. 6
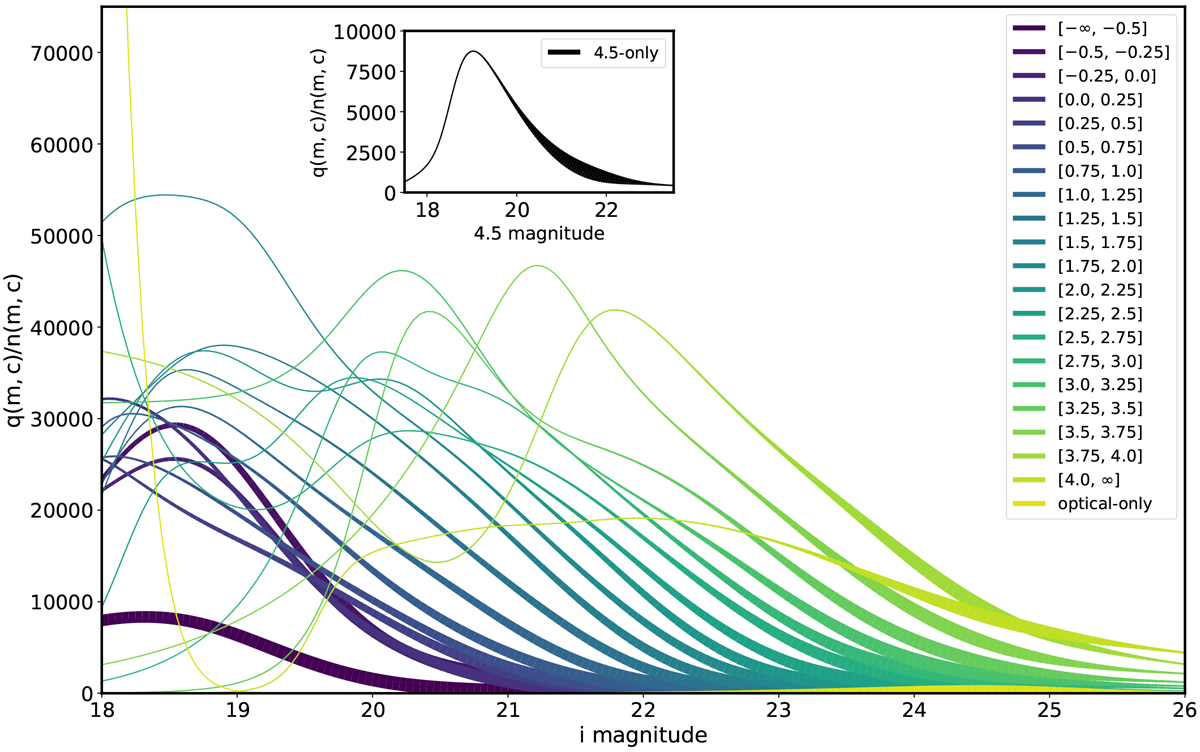
q(m, c)∕n(m, c) ratio distributions versus magnitude across the (i - 4.5) colour bins in ELAIS-N1. The inset shows the same for the 4.5-only bin. The ratios are computed in bins of 0.5 mag (and smoothed using a KDE), with the thickness of the lines corresponding to the number of sources within a given magnitude bin (i.e. thicker lines represent better constrained regions of parameter space). The numbers in the legend correspond to the bin edges in (i - 4.5) colour space. The evolution of the peak and thickness of the curve across the colour bins indicate that radio galaxies are more likely to be hosted by redder galaxies, especially at faint magnitudes.
Current usage metrics show cumulative count of Article Views (full-text article views including HTML views, PDF and ePub downloads, according to the available data) and Abstracts Views on Vision4Press platform.
Data correspond to usage on the plateform after 2015. The current usage metrics is available 48-96 hours after online publication and is updated daily on week days.
Initial download of the metrics may take a while.