Fig. 5
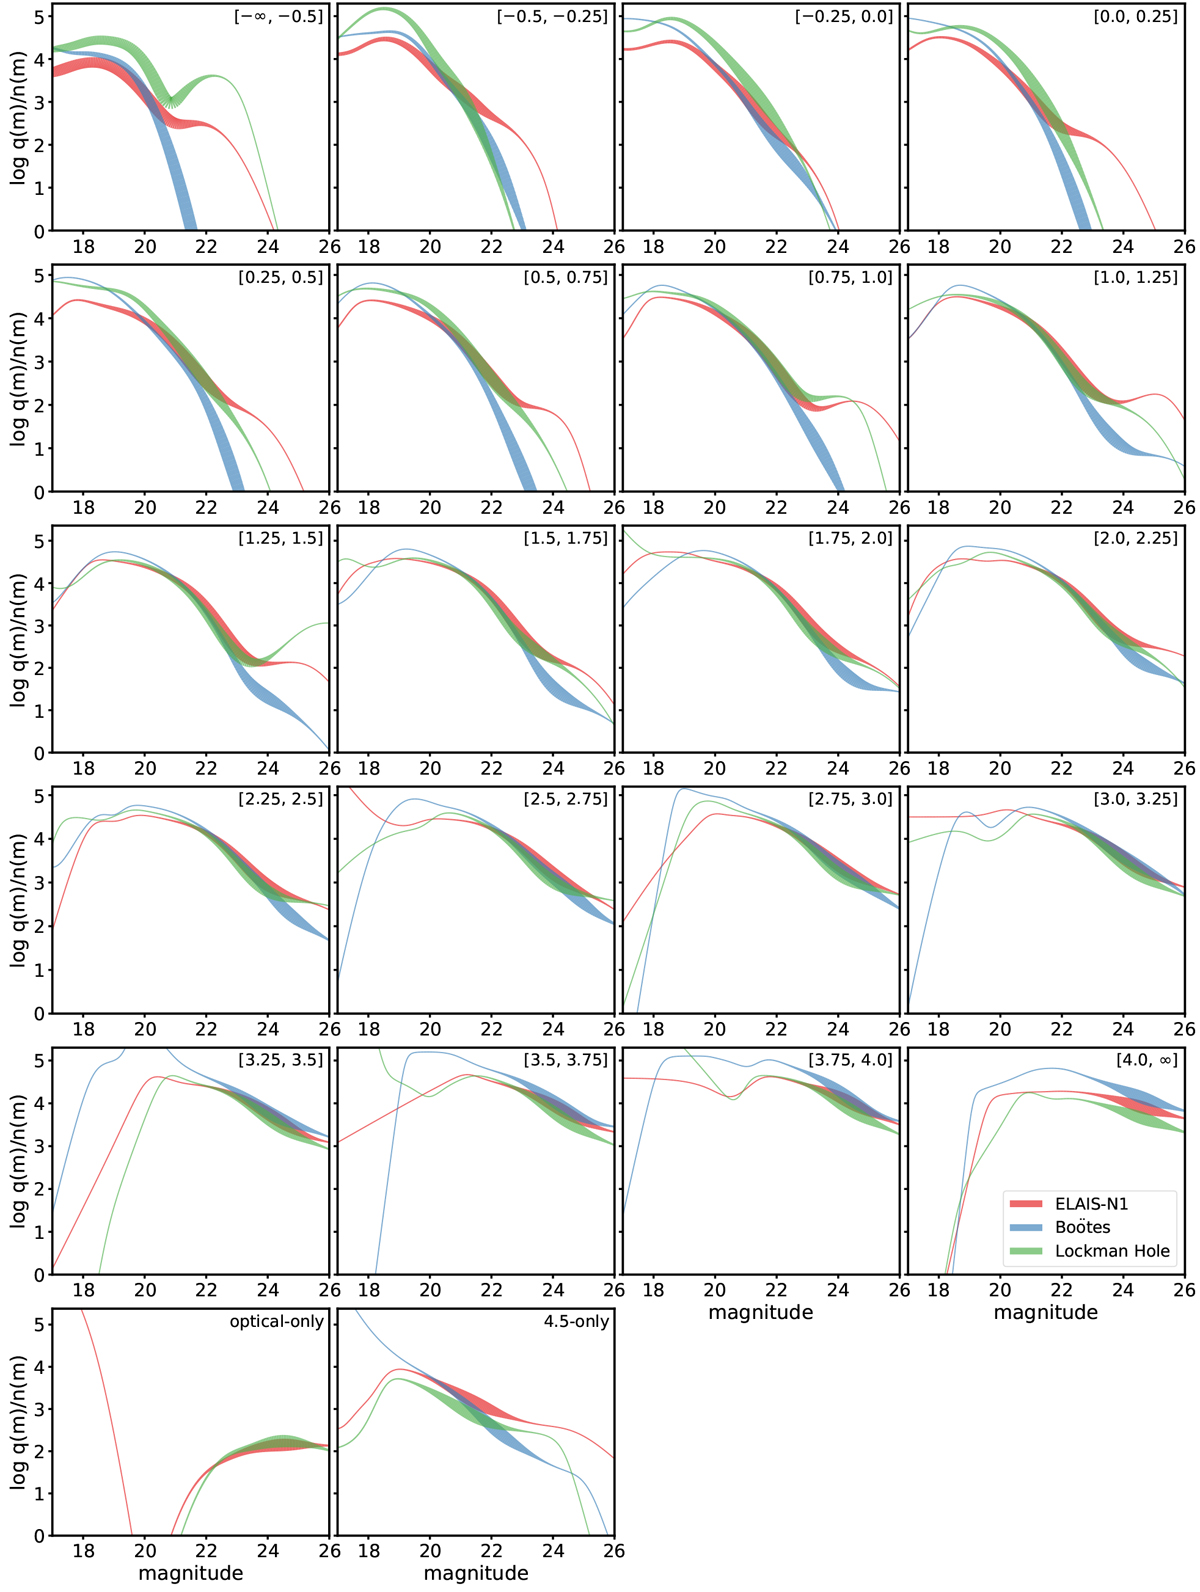
q(m, c)∕n(m, c) ratio distributions versus magnitude, smoothed using a KDE. The x-axis displays the optical magnitude in each colour bin, except for the 4.5-only category where the 4.5 μm magnitudeis used. The width of the lines corresponds to the number of radio sources within that magnitude bin (hence, the thicker lines indicate well-constrained regions of parameter space). The optical magnitudes plotted are the same as those chosen for the LR analysis (i-band for ELAIS-N1, I-band for Boötes and r-band for Lockman Hole). Although these filters are different, no attempt at filter or colour transformation is made (see Sect. 4.2.4). Even without these corrections, the distributions agree well between the three fields, especially considering the log scaling of the y-axis.
Current usage metrics show cumulative count of Article Views (full-text article views including HTML views, PDF and ePub downloads, according to the available data) and Abstracts Views on Vision4Press platform.
Data correspond to usage on the plateform after 2015. The current usage metrics is available 48-96 hours after online publication and is updated daily on week days.
Initial download of the metrics may take a while.