Fig. 4
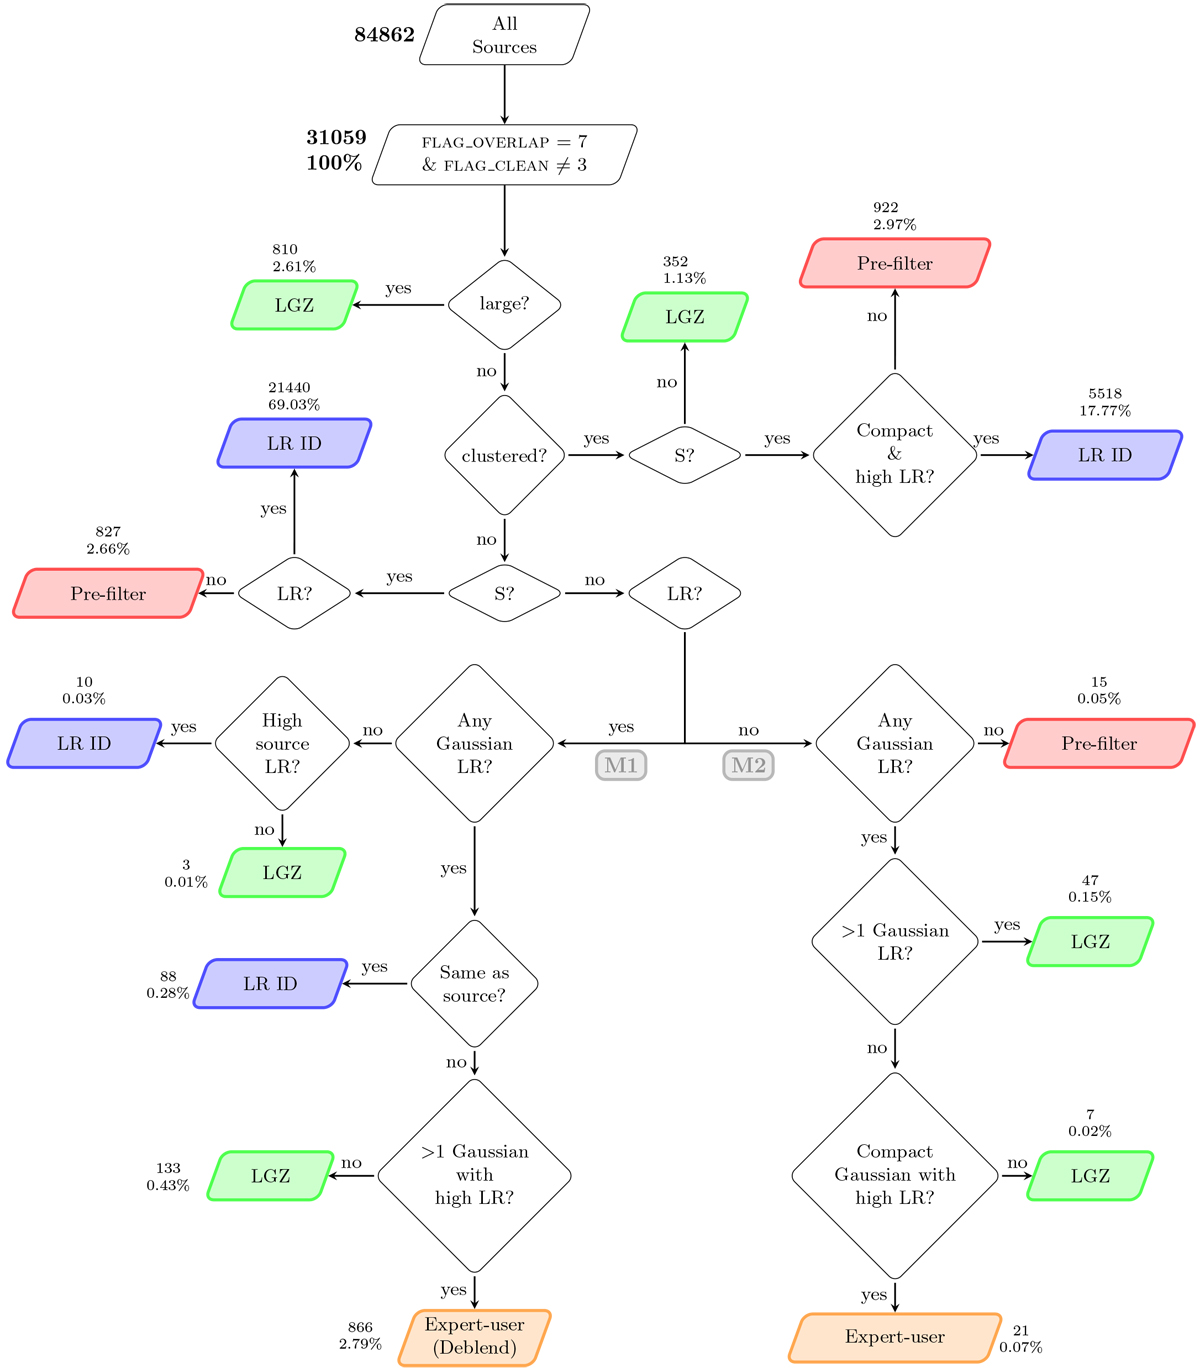
Flowchart developed for the deep fields to select the most appropriate method (end-point) for identification (LR or visual) based on properties of the radio source and LR-identification (if any). The “LR-ID” end-point indicates that the LR cross-match is accepted (see Sect. 4.2). Sources with the end-point of “LGZ”, “pre-filter” and “expert-user workflow” are sent to their respective visual classification and identification workflows (see Sect. 4.3). The numbers and percentages of sources at each end-point relate to the total number of sources in the PYBDSF catalogue within our defined multi-wavelength area (FLAG_OVERLAP = 7; see Table 5) and not in the Spitzer-masked region (FLAG_CLEAN ≠ 3; see Table 4), corresponding to 31059 PYBDSF sources. Table 6 lists the definitions used for each decision block. The decision tree is described in detail in Sect. 4.1. In ELAIS-N1, 27056 (87.1%) of sources were selected as suitable for analysis by the statistical LR method, with the rest (4003 sources = 12.9%) selected as requiring some form of visual classification.
Current usage metrics show cumulative count of Article Views (full-text article views including HTML views, PDF and ePub downloads, according to the available data) and Abstracts Views on Vision4Press platform.
Data correspond to usage on the plateform after 2015. The current usage metrics is available 48-96 hours after online publication and is updated daily on week days.
Initial download of the metrics may take a while.