Fig. 3
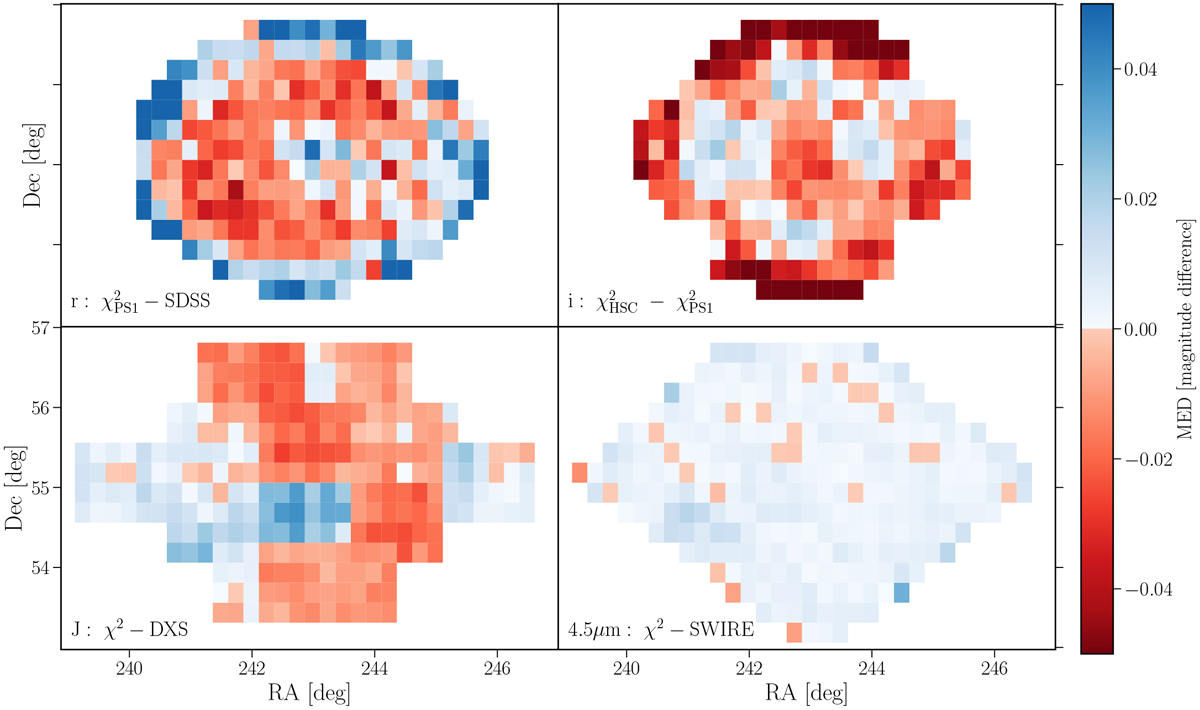
Comparison of photometry in the r, i, J and 4.5 μm bands in ELAIS-N1. The colour-map shows the median magnitude difference computed over cells of 0.06 deg2 between our χ2 and publicly available catalogues from SDSS DR12, DXS DR10 and the SWIRE survey for the r, J and 4.5 μm bands, respectively. For the i-band, we compare the photometry between PS1 and HSC within our χ2 catalogue. We use aperture corrected magnitudes based on the 3 arcsec aperture for optical-NIR bands and 4 arcsec for the 4.5 μm band. There is excellent agreement between our χ2 and publicly released catalogues, with differences in optical bands likely driven by zero-point calibration of individual PS1 chips.
Current usage metrics show cumulative count of Article Views (full-text article views including HTML views, PDF and ePub downloads, according to the available data) and Abstracts Views on Vision4Press platform.
Data correspond to usage on the plateform after 2015. The current usage metrics is available 48-96 hours after online publication and is updated daily on week days.
Initial download of the metrics may take a while.