Fig. 11
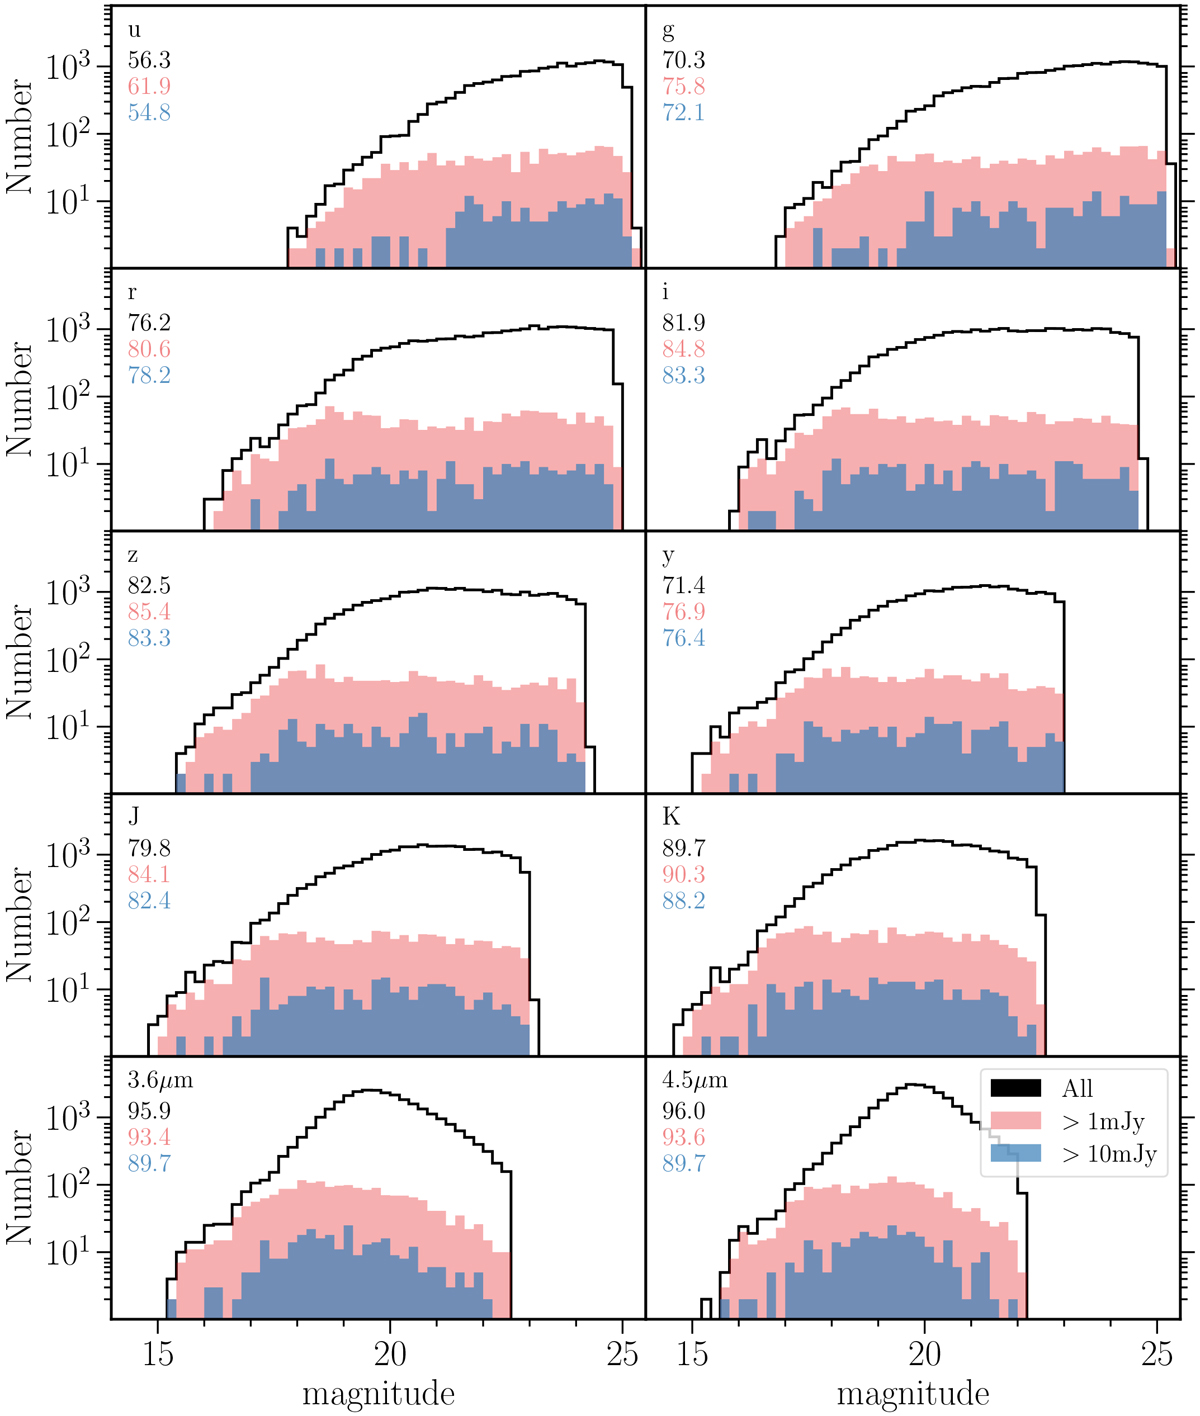
Magnitude distributions of the host galaxies of radio sources in optical (SpARCS and PanSTARRS) to IR bands in ELAIS-N1. Each panel also shows the same for the subset of radio sources with radio flux densities >1mJy (pink) and >10mJy (blue). The numbers in each panel corresponds to the fraction of all radio sources with a counterpart detected in that band, for all sources, and for >1 and >10 mJy sources. The identification fraction increases with wavelength from ~56% in u-band up to 96% in 4.5 μm.
Current usage metrics show cumulative count of Article Views (full-text article views including HTML views, PDF and ePub downloads, according to the available data) and Abstracts Views on Vision4Press platform.
Data correspond to usage on the plateform after 2015. The current usage metrics is available 48-96 hours after online publication and is updated daily on week days.
Initial download of the metrics may take a while.