Fig. 10
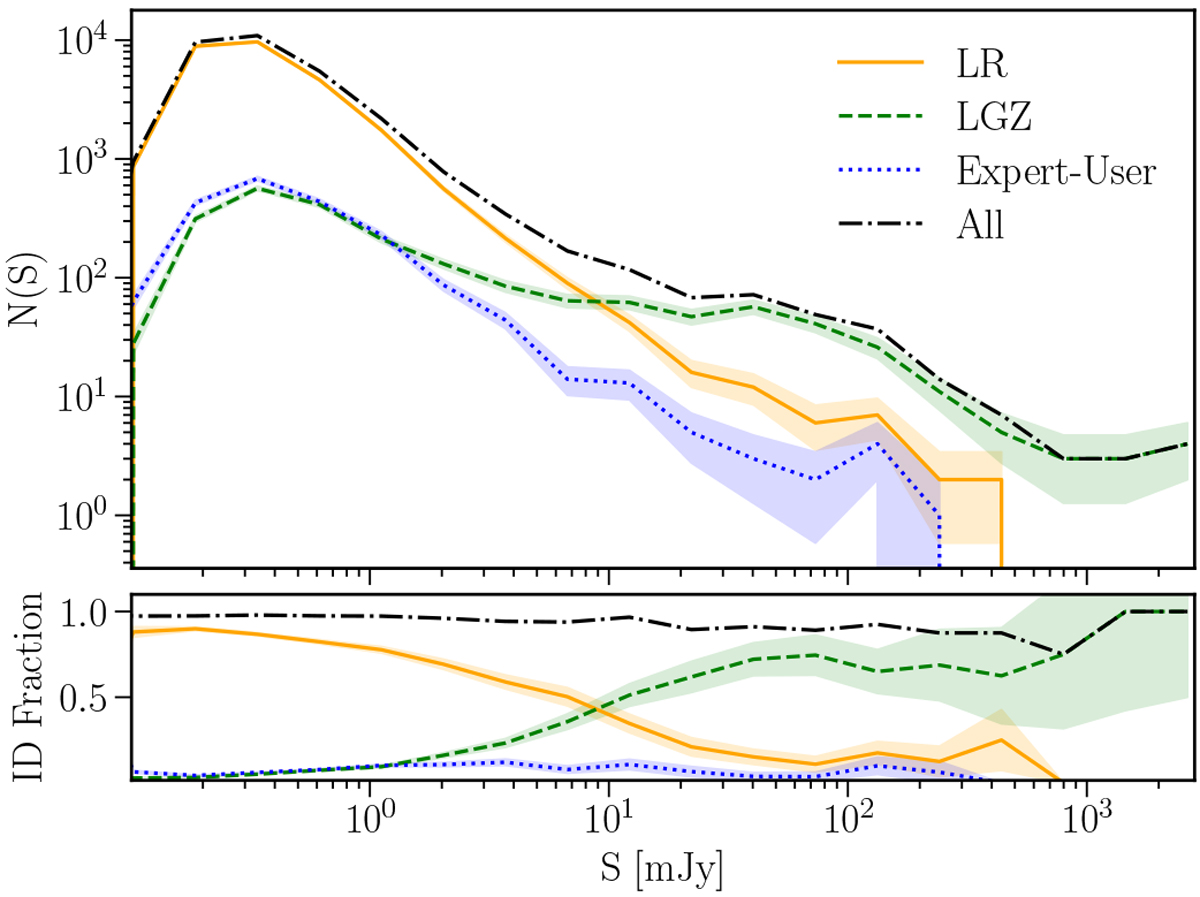
Top:number of radio sources with identifications as a function of radio flux density and the identification method used (LR, LGZ or “expert user workflow”). The flux density distribution of all sources with identification is shown by the dot-dashed black line. Bottom: identification fraction as a function of the flux density, also split by the identification method. The identification fraction is computed based on the total number of radio sources (with or without an identification). The LGZ method dominates the identification rate above ~10mJy, with the LRmethod dominating below this. The filled regions show Poisson error estimates.
Current usage metrics show cumulative count of Article Views (full-text article views including HTML views, PDF and ePub downloads, according to the available data) and Abstracts Views on Vision4Press platform.
Data correspond to usage on the plateform after 2015. The current usage metrics is available 48-96 hours after online publication and is updated daily on week days.
Initial download of the metrics may take a while.