Fig. 1
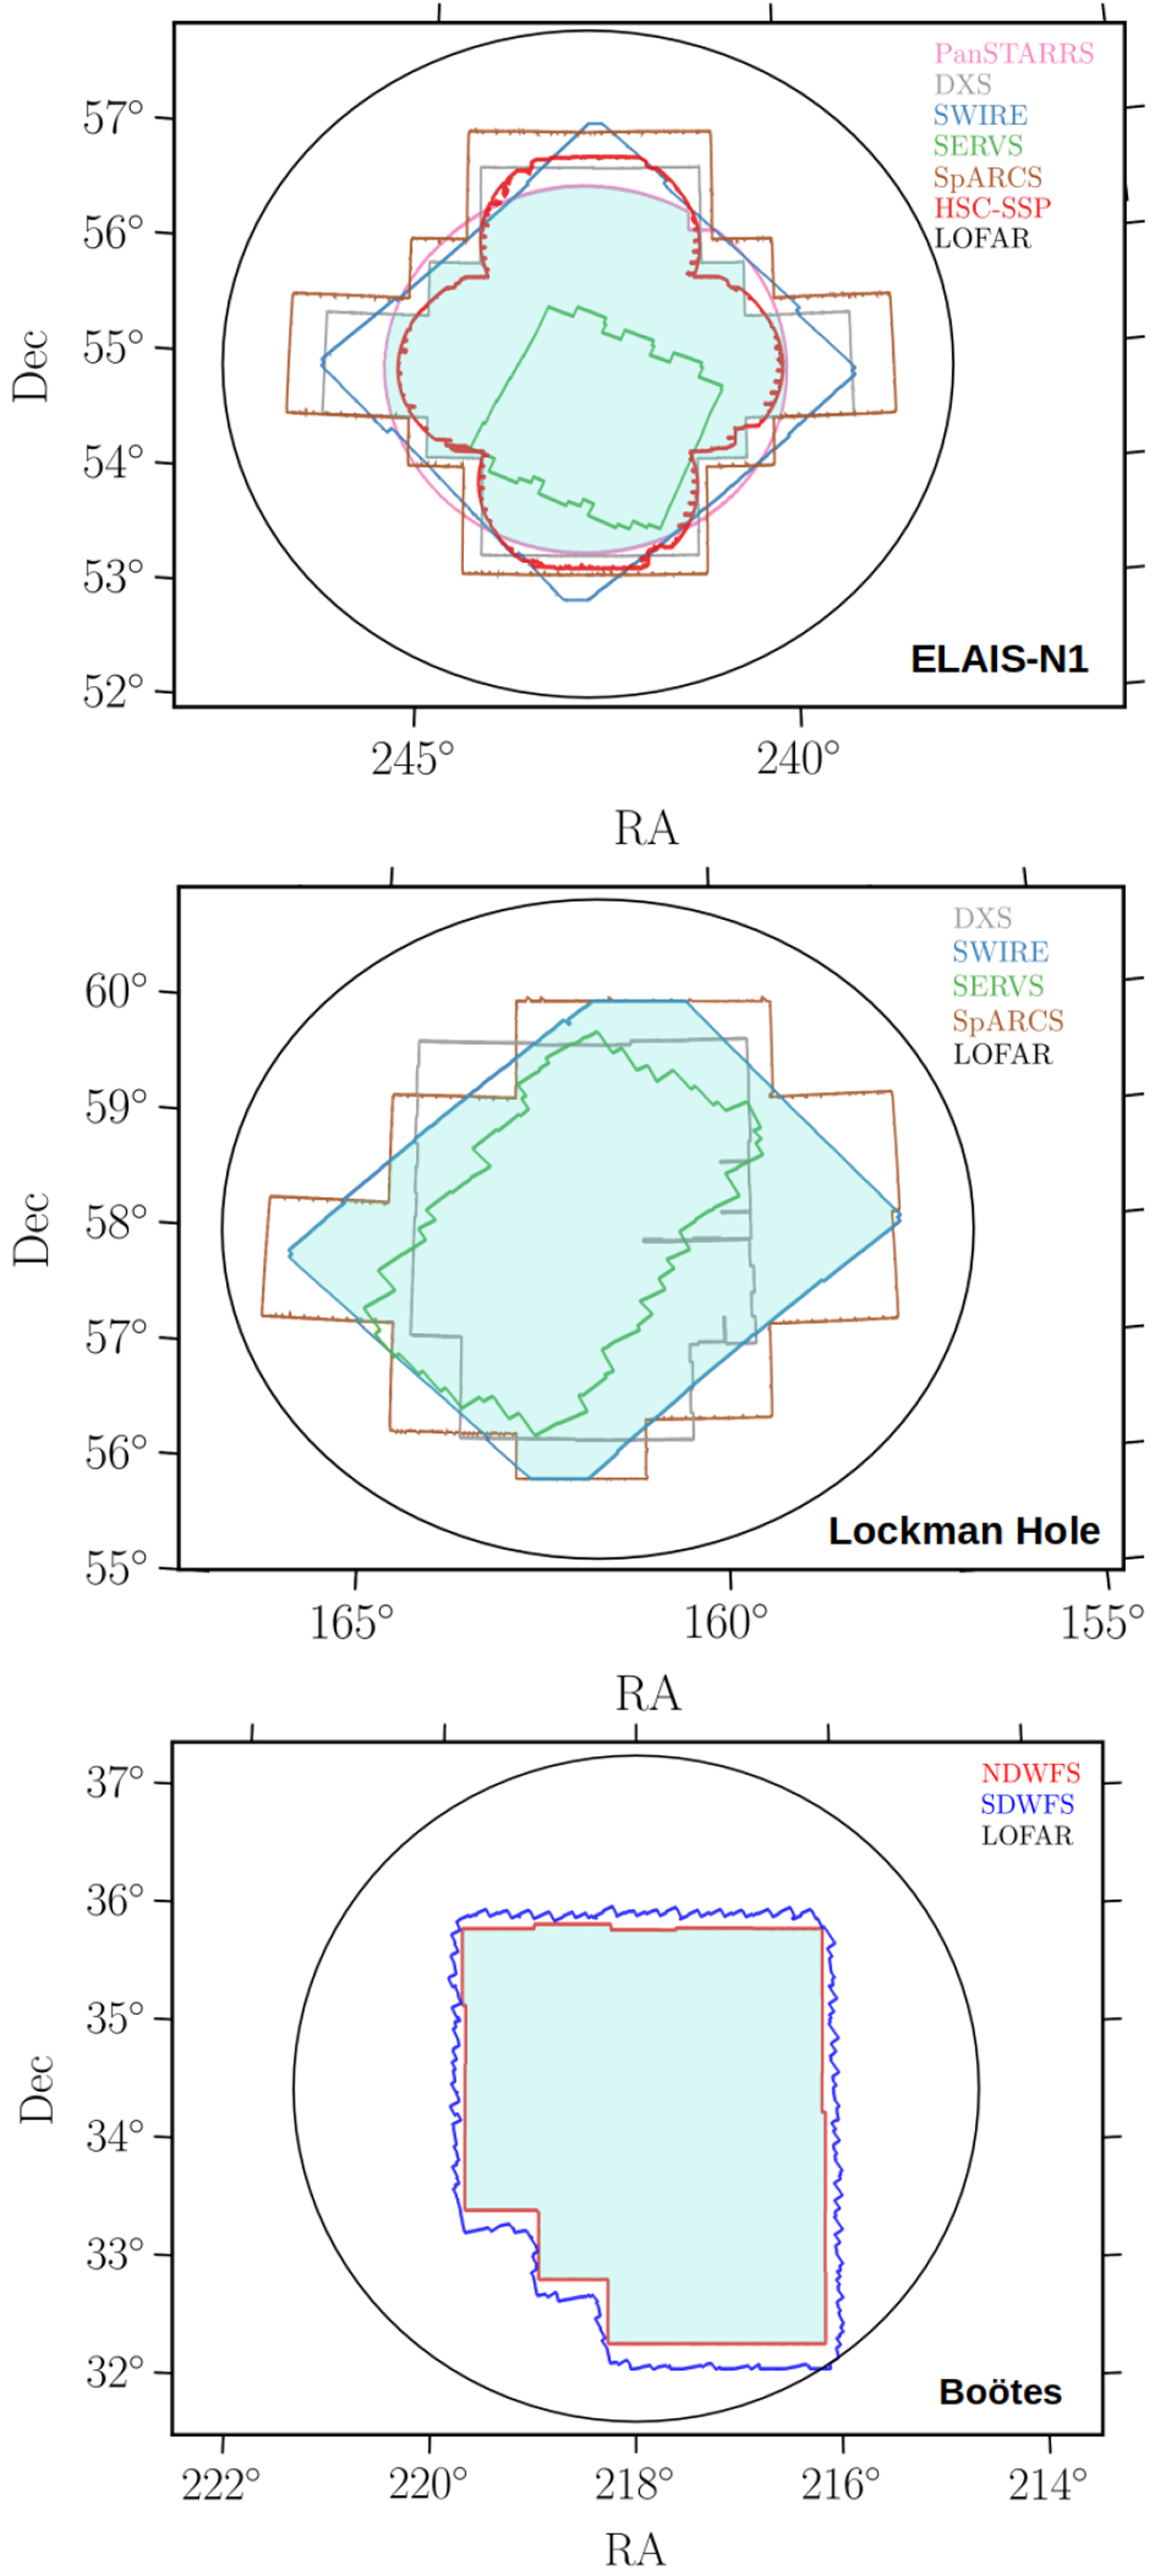
Footprint (north up, east left) for ELAIS-N1 (top) Lockman Hole (middle) and Boötes (bottom) showing the coverage of multi-wavelength data from various surveys in optical and IR bands described in Sects. 2.2–2.4. The LOFAR radio coverage is also shown in black. The shaded light blue region shows the selected area of overlap that is used for the radio-optical cross-match in this paper for ELAIS-N1 (~7.15 deg2), Lockman Hole (~10.73 deg2) and Boötes (~9.5deg2), as described in Sects. 2.2.3, 2.3.3 and 2.4, respectively, with slightly reduced area after bright-star masking.
Current usage metrics show cumulative count of Article Views (full-text article views including HTML views, PDF and ePub downloads, according to the available data) and Abstracts Views on Vision4Press platform.
Data correspond to usage on the plateform after 2015. The current usage metrics is available 48-96 hours after online publication and is updated daily on week days.
Initial download of the metrics may take a while.