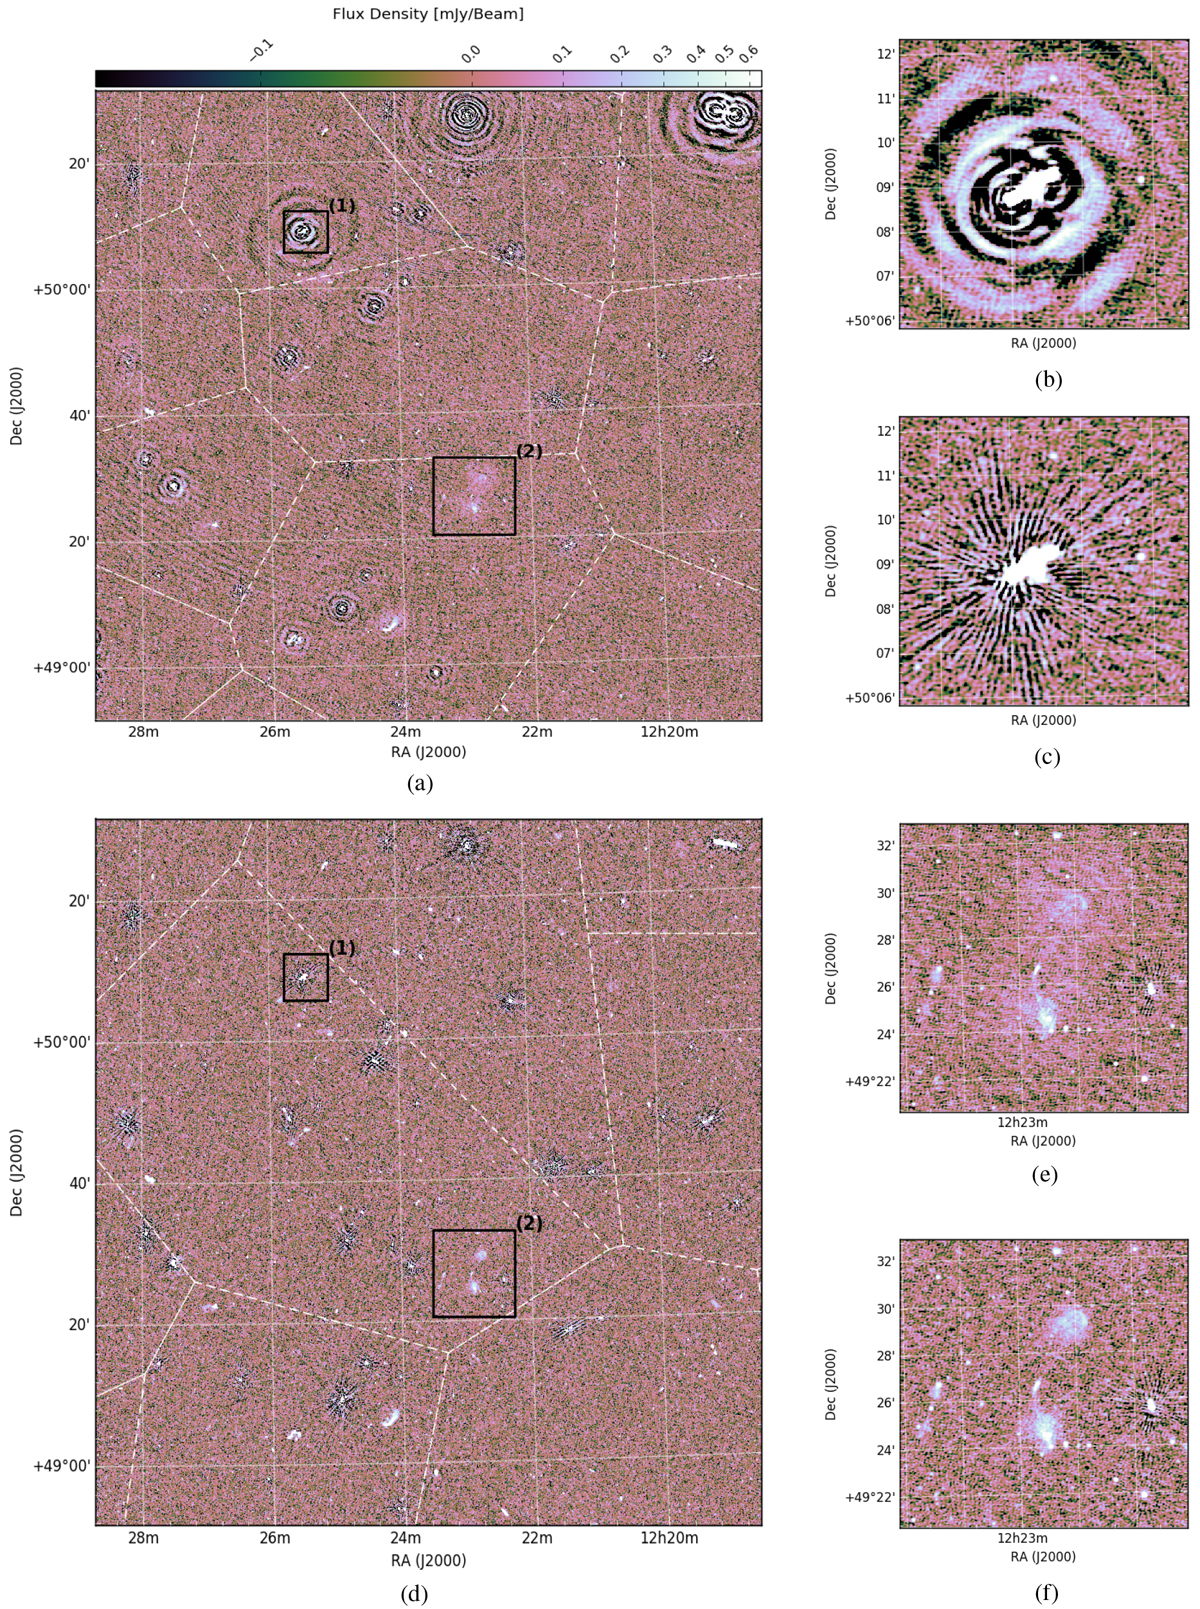
Fig. 8

Differences between the maps produced by Algorithms 0 and 1 from typical eight-hour scans (here the P26HETDEX03 pointing in the Hobby-Eberly Telescope Dark Energy Experiment, HETDEX, field, see Shimwell et al. 2017). The color scale is the same on all panels and is displayed using an inverse hyperbolic sine function to render both the low level artifacts and some bright sources. (a) The central part of the P26Hetdex03 8 hours LOFAR-HBA scan as imaged by Alg. 0. (b) Region (1) as imaged by Alg. 0. (c) Region (1) as imaged by Algorithm 1. (d) The central part of the P26Hetdex03 eight-hour LOFAR-HBA scan as imaged by Algorithm 1. (e) Region (2) as imaged by Algorithm 0. (f) Region (2) as imaged by Algorithm 1.
Current usage metrics show cumulative count of Article Views (full-text article views including HTML views, PDF and ePub downloads, according to the available data) and Abstracts Views on Vision4Press platform.
Data correspond to usage on the plateform after 2015. The current usage metrics is available 48-96 hours after online publication and is updated daily on week days.
Initial download of the metrics may take a while.


