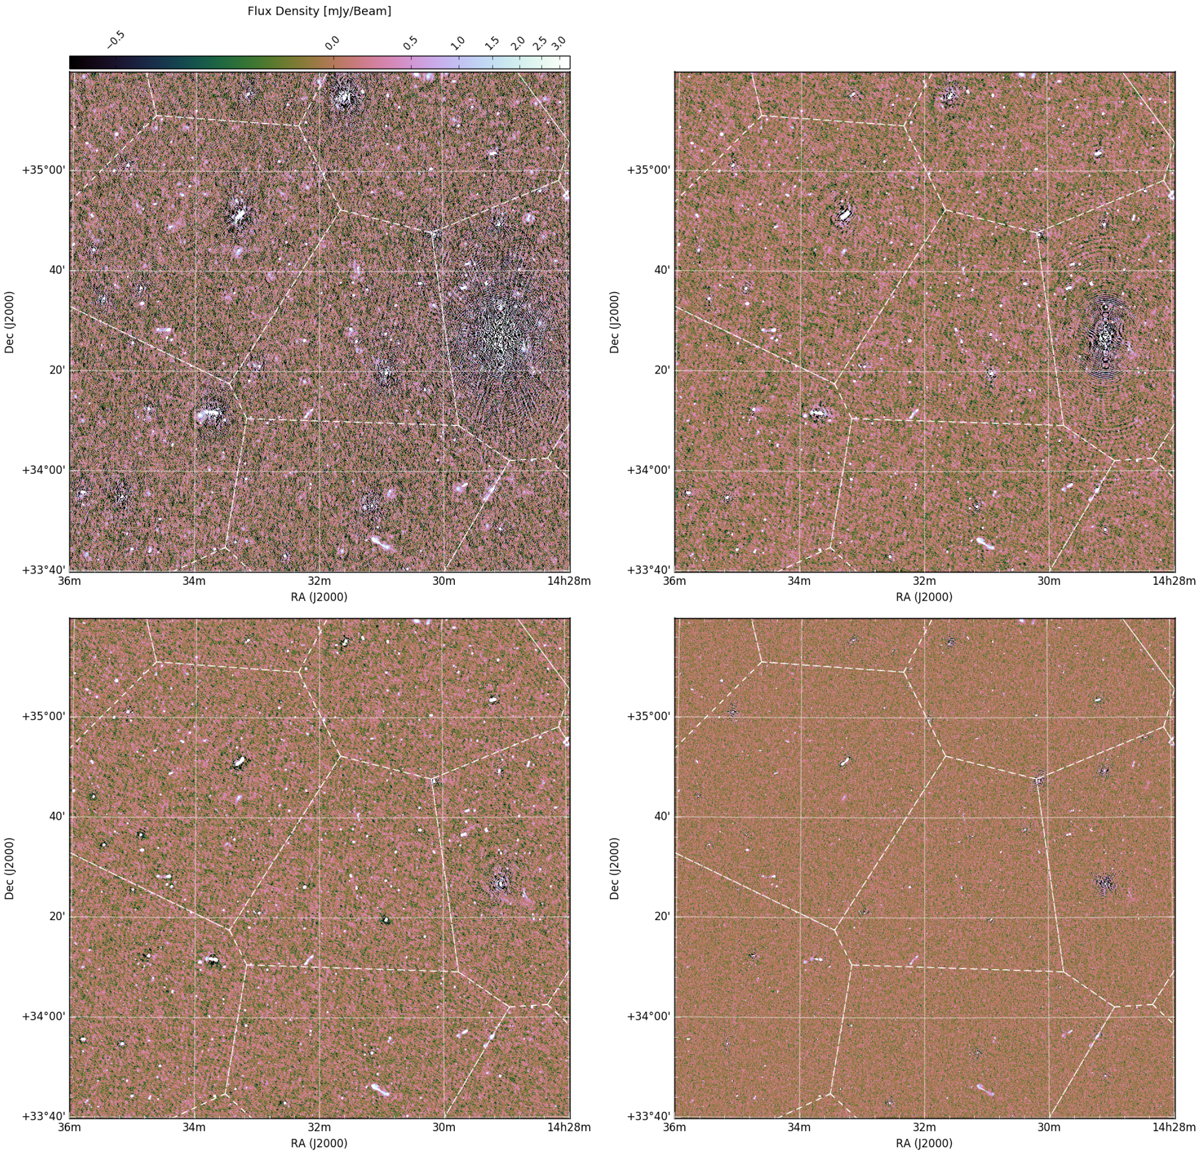
Fig. 2

Some of the images produced at different steps in the DD self-calibration loop implemented as Algorithm 1. The maps correspond (from left to right, top to bottom) to Steps 1.1, 1.8, 1.12, and 1.18, respectively. The white lines show the facet locations. The color scale is the same on all panels and is displayed using an inverse hyperbolic sine function to render both the low level artifacts and some bright sources.
Current usage metrics show cumulative count of Article Views (full-text article views including HTML views, PDF and ePub downloads, according to the available data) and Abstracts Views on Vision4Press platform.
Data correspond to usage on the plateform after 2015. The current usage metrics is available 48-96 hours after online publication and is updated daily on week days.
Initial download of the metrics may take a while.


