Free Access
Fig. 7
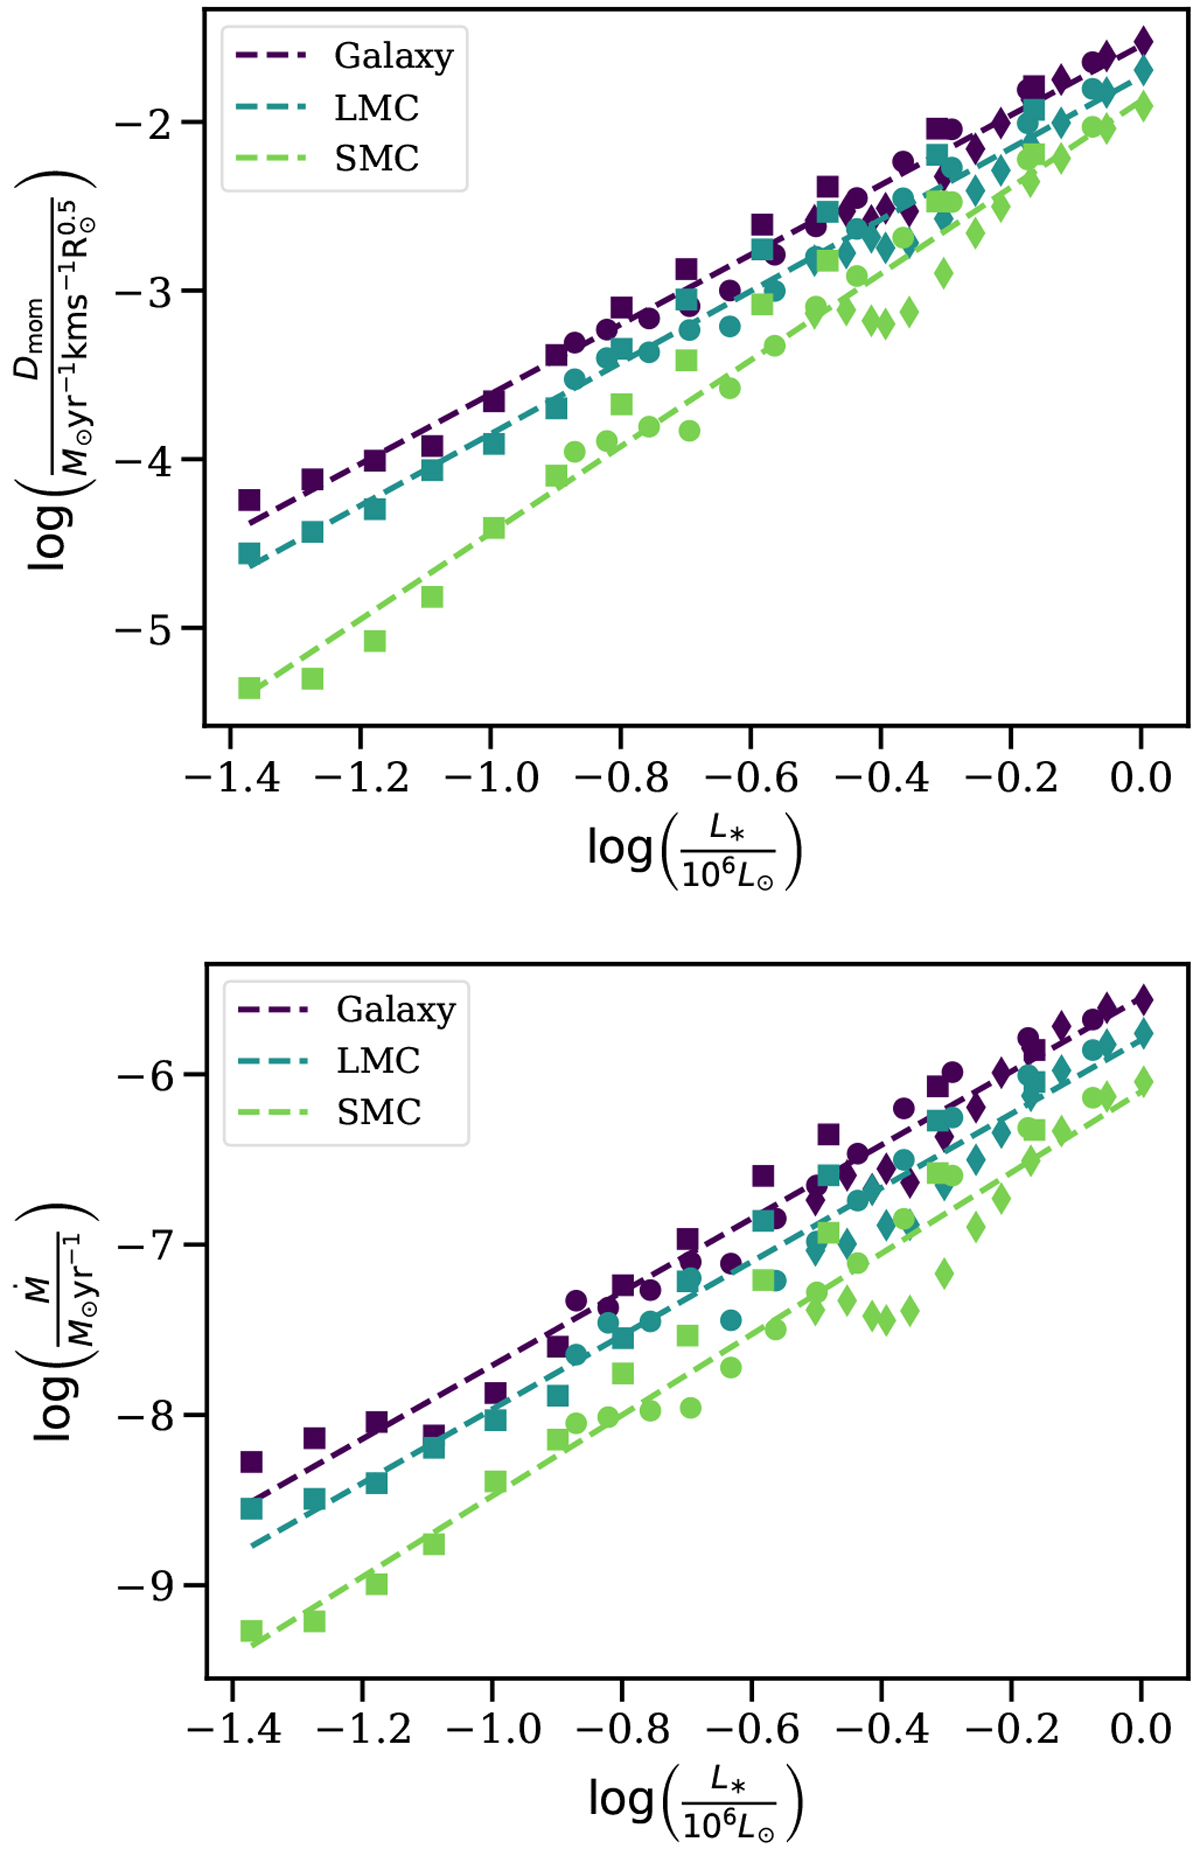
Top panel: modified wind-momentum rate of all models versus luminosity. The dashed lines show linear fits through each of the three sets of models. The markers show the different luminosity classes, consistent with previous plots. Bottom panel: same as the top panel, but for the mass-loss rate.
Current usage metrics show cumulative count of Article Views (full-text article views including HTML views, PDF and ePub downloads, according to the available data) and Abstracts Views on Vision4Press platform.
Data correspond to usage on the plateform after 2015. The current usage metrics is available 48-96 hours after online publication and is updated daily on week days.
Initial download of the metrics may take a while.