Free Access
Fig. 3
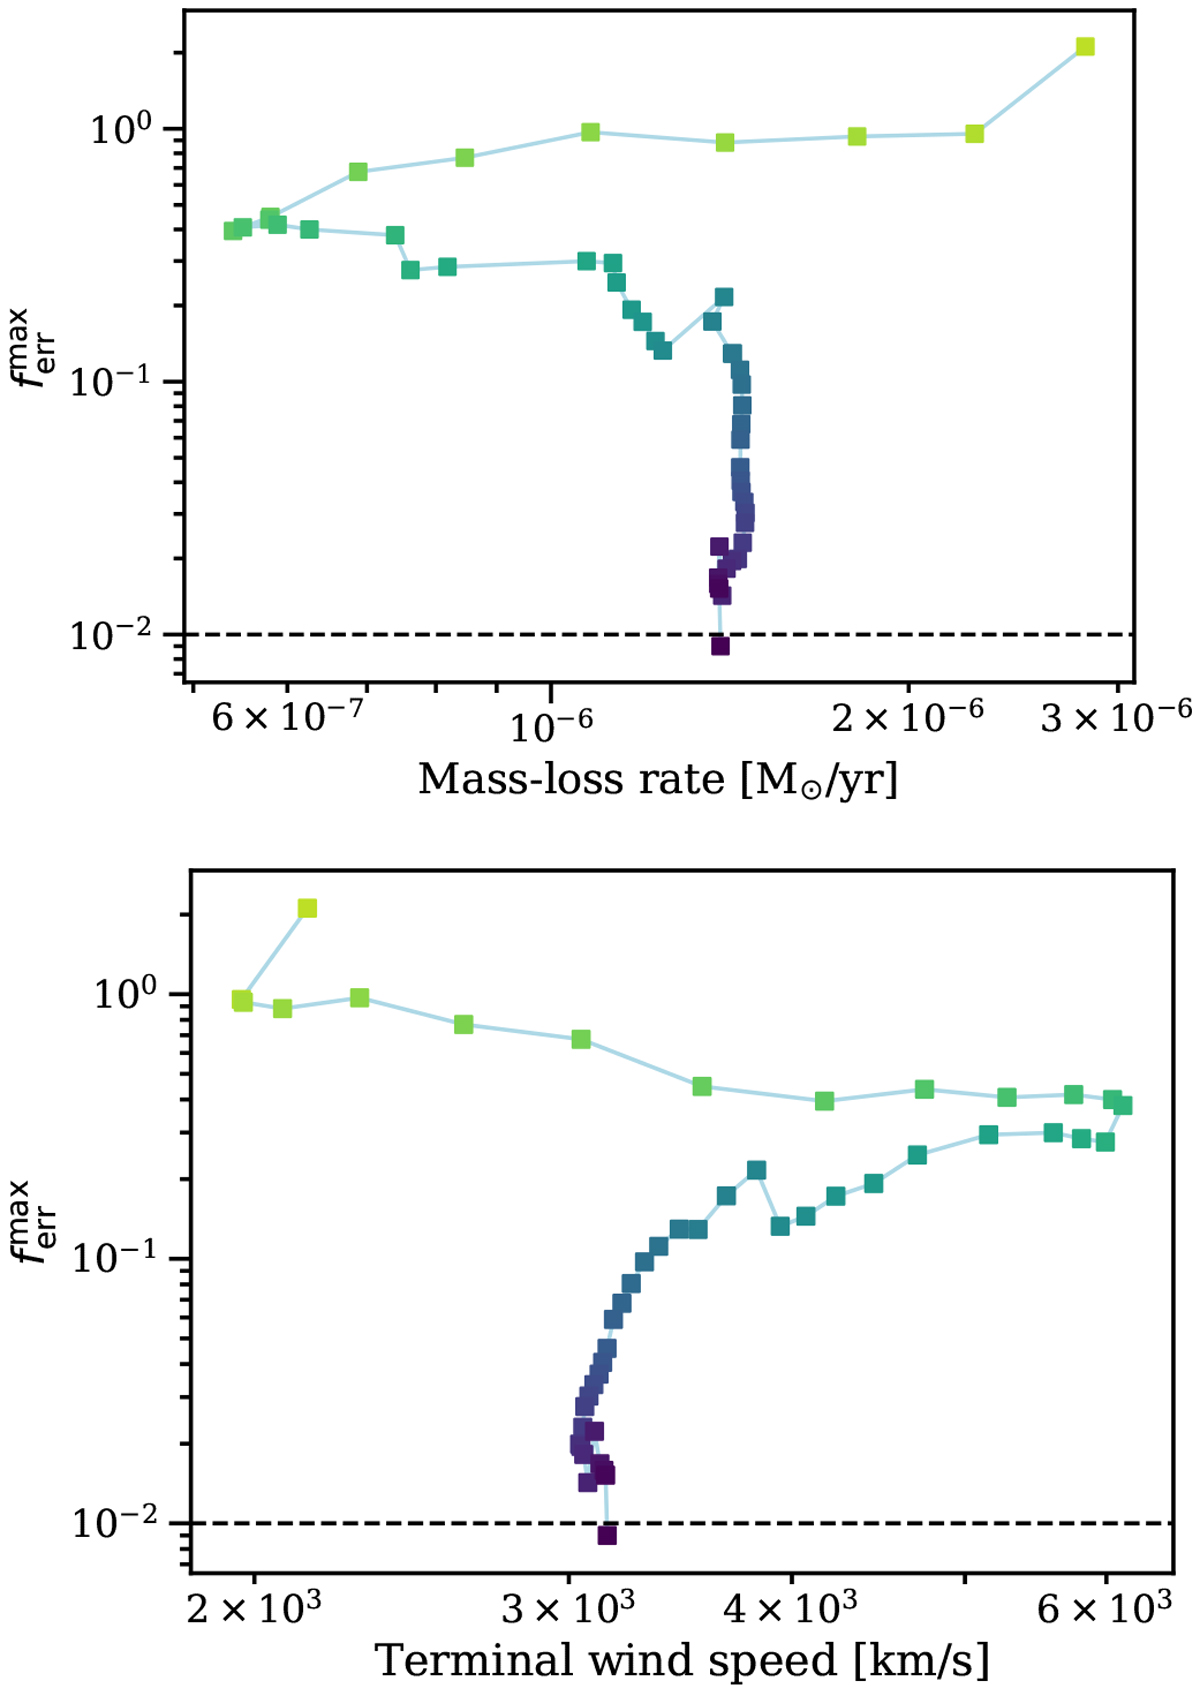
Top panel: iterative behaviour of the mass-loss rate as ![]() decreases towards a value below 1%. The colour signifies the iteration number starting from Ṁ as predicted by the Vink et al recipe in light green. Bottom panel: iterative behaviour of the terminal velocity v∞ towards convergence.
decreases towards a value below 1%. The colour signifies the iteration number starting from Ṁ as predicted by the Vink et al recipe in light green. Bottom panel: iterative behaviour of the terminal velocity v∞ towards convergence.
Current usage metrics show cumulative count of Article Views (full-text article views including HTML views, PDF and ePub downloads, according to the available data) and Abstracts Views on Vision4Press platform.
Data correspond to usage on the plateform after 2015. The current usage metrics is available 48-96 hours after online publication and is updated daily on week days.
Initial download of the metrics may take a while.