Fig. 10
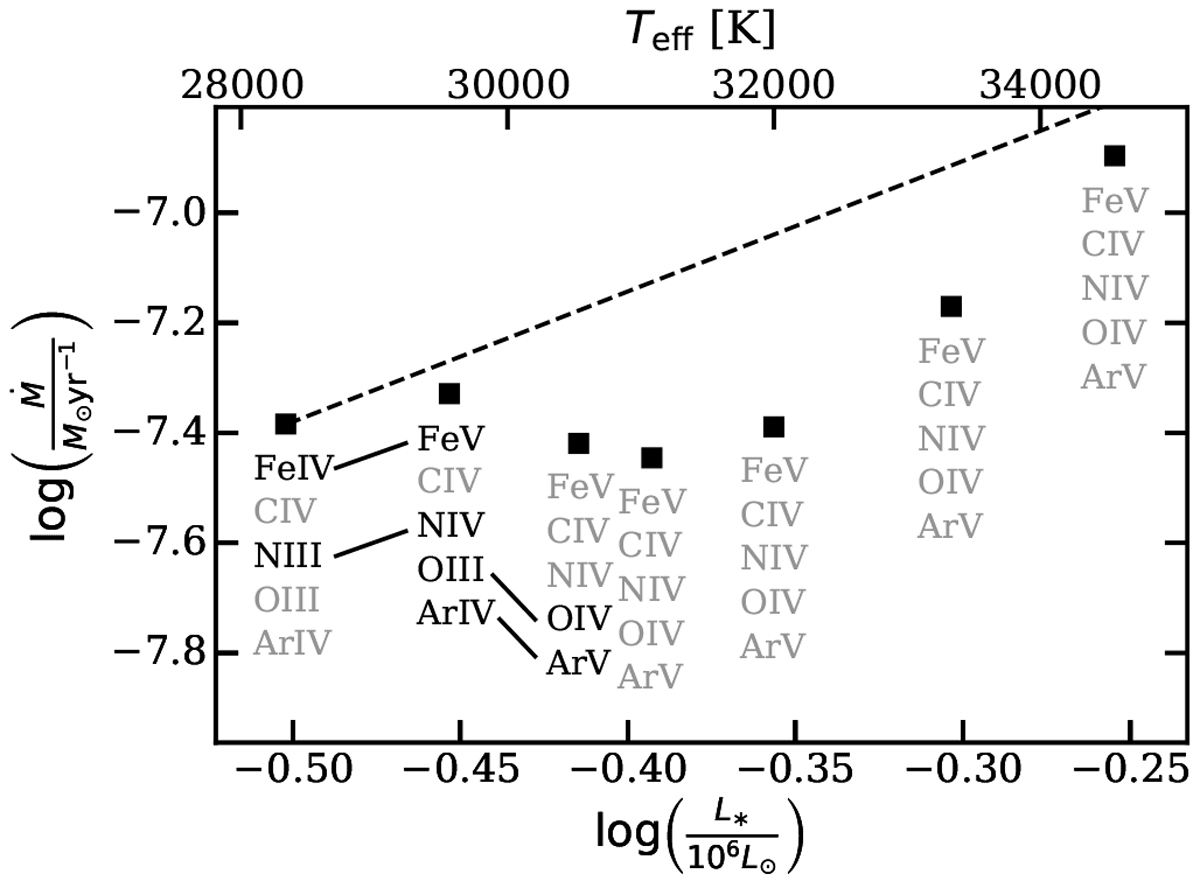
Zoom in on the ‘bump’ that is notably present for the supergiants at SMC metallicity plotted as mass-loss rate versus luminosity on the lower axis and effective temperature on the upper axis. The dashed line shows the reference slope of 2.37 derived from all SMC models. Each model shows the dominant ionisation stage at the critical point of five elements. They are connected when a transition occurs between models.
Current usage metrics show cumulative count of Article Views (full-text article views including HTML views, PDF and ePub downloads, according to the available data) and Abstracts Views on Vision4Press platform.
Data correspond to usage on the plateform after 2015. The current usage metrics is available 48-96 hours after online publication and is updated daily on week days.
Initial download of the metrics may take a while.