Fig. 1
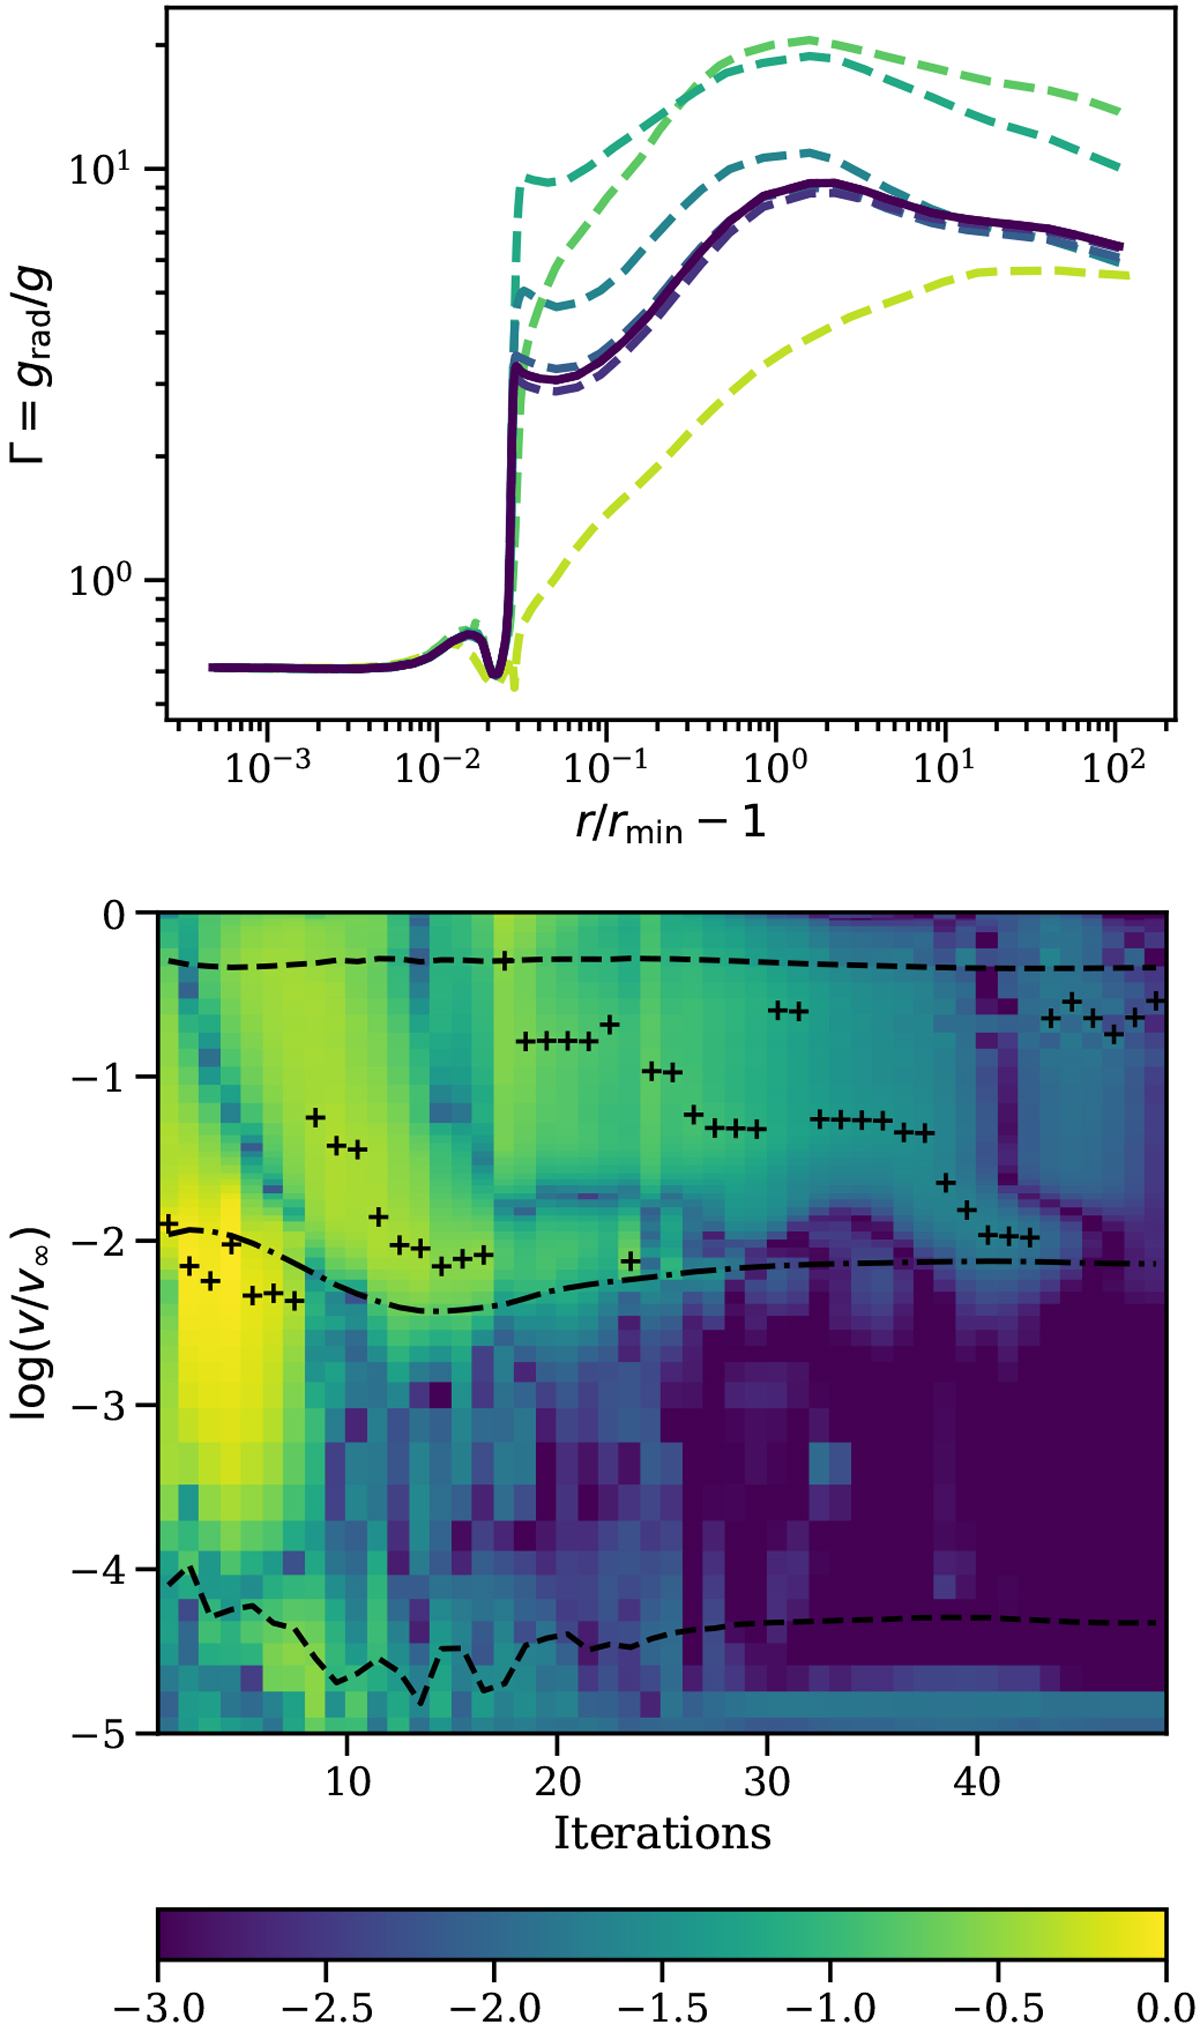
Top panel: value of Γ versus scaled radius-coordinate for 7 (non-consecutive) hydrodynamic iterations over the complete run. The starting structure (yellow) relaxes to the final converged structure (dark blue). Bottom panel: colour map of log (ferr) for all hydrodynamic iterations; on the abscissa is hydrodynamic iteration number and on the ordinate scaled wind velocity. The pluses indicate the location of ![]() for each iteration, the dashed lines the limits between which
for each iteration, the dashed lines the limits between which ![]() is computedand the dash-dotted line the location of the sonic point.
is computedand the dash-dotted line the location of the sonic point.
Current usage metrics show cumulative count of Article Views (full-text article views including HTML views, PDF and ePub downloads, according to the available data) and Abstracts Views on Vision4Press platform.
Data correspond to usage on the plateform after 2015. The current usage metrics is available 48-96 hours after online publication and is updated daily on week days.
Initial download of the metrics may take a while.