Free Access
Fig. 7
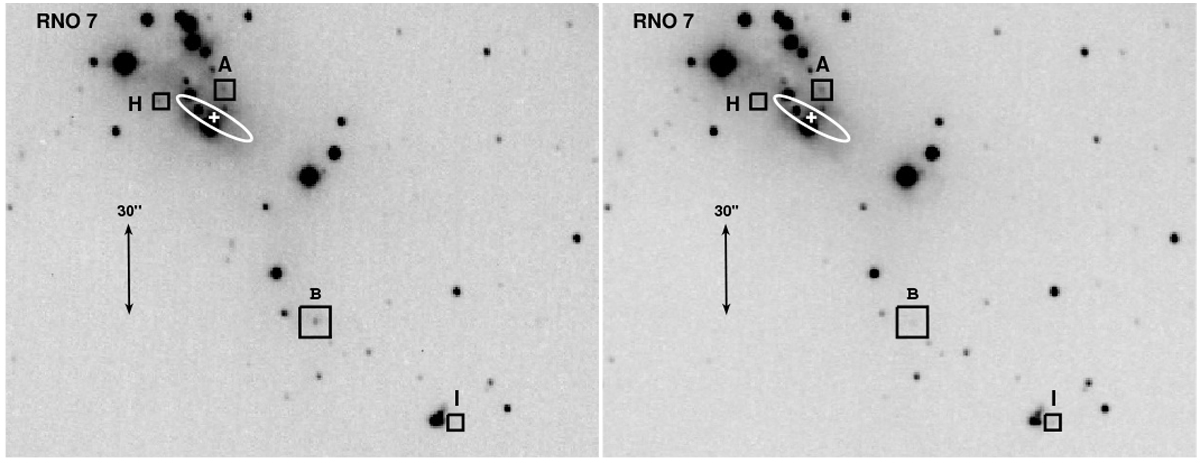
IRAS 02236+7224: close-up of the CAHA images through the Hα (left) and [S II] (right) filters, showing the field around the RNO 7 cluster where the IRAS source is located. The position of the IRASsource and its error ellipse are indicated. The knots are enclosed in boxes.
Current usage metrics show cumulative count of Article Views (full-text article views including HTML views, PDF and ePub downloads, according to the available data) and Abstracts Views on Vision4Press platform.
Data correspond to usage on the plateform after 2015. The current usage metrics is available 48-96 hours after online publication and is updated daily on week days.
Initial download of the metrics may take a while.