Free Access
Fig. 26
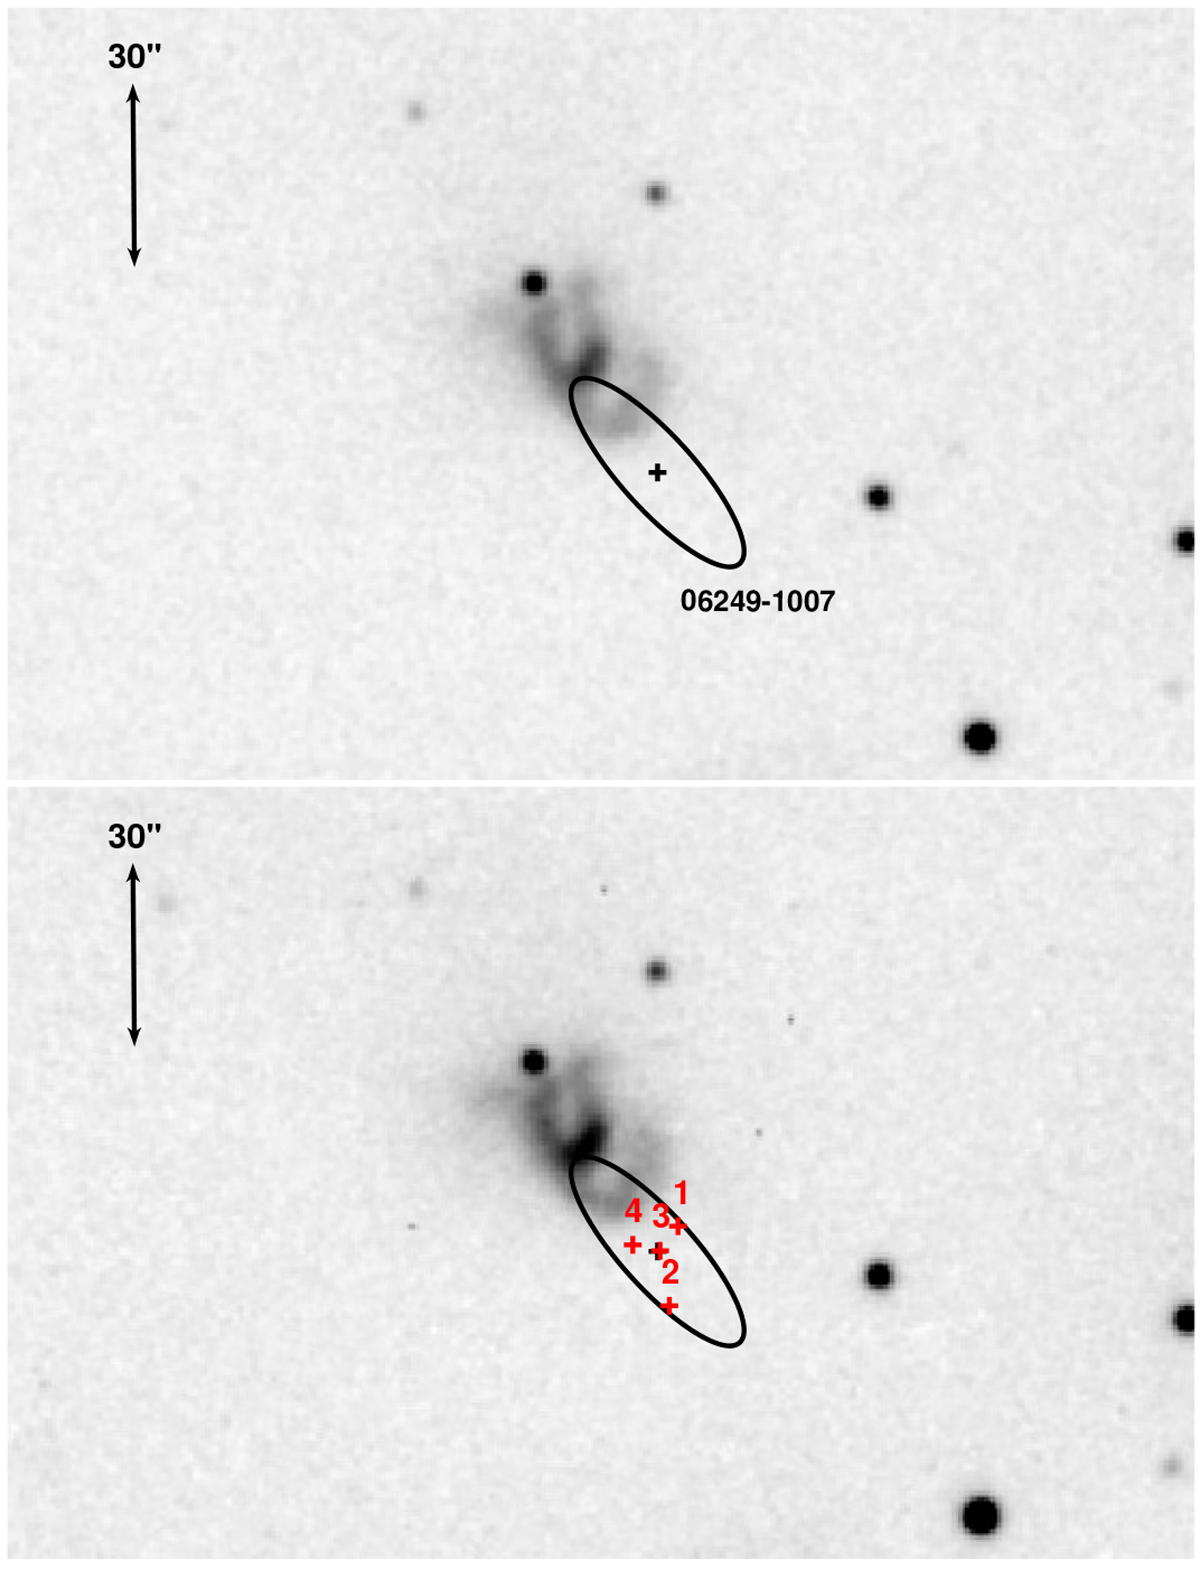
IRAS 06249−1007: Close-up of the CAHA image through the Hα (top) and [SII] (bottom) filters showing the field centered on the IRAS source The stars of the IR cluster reported by Tapia et al. (1997) are shown as plus signs (+).
Current usage metrics show cumulative count of Article Views (full-text article views including HTML views, PDF and ePub downloads, according to the available data) and Abstracts Views on Vision4Press platform.
Data correspond to usage on the plateform after 2015. The current usage metrics is available 48-96 hours after online publication and is updated daily on week days.
Initial download of the metrics may take a while.