Free Access
Fig. 18
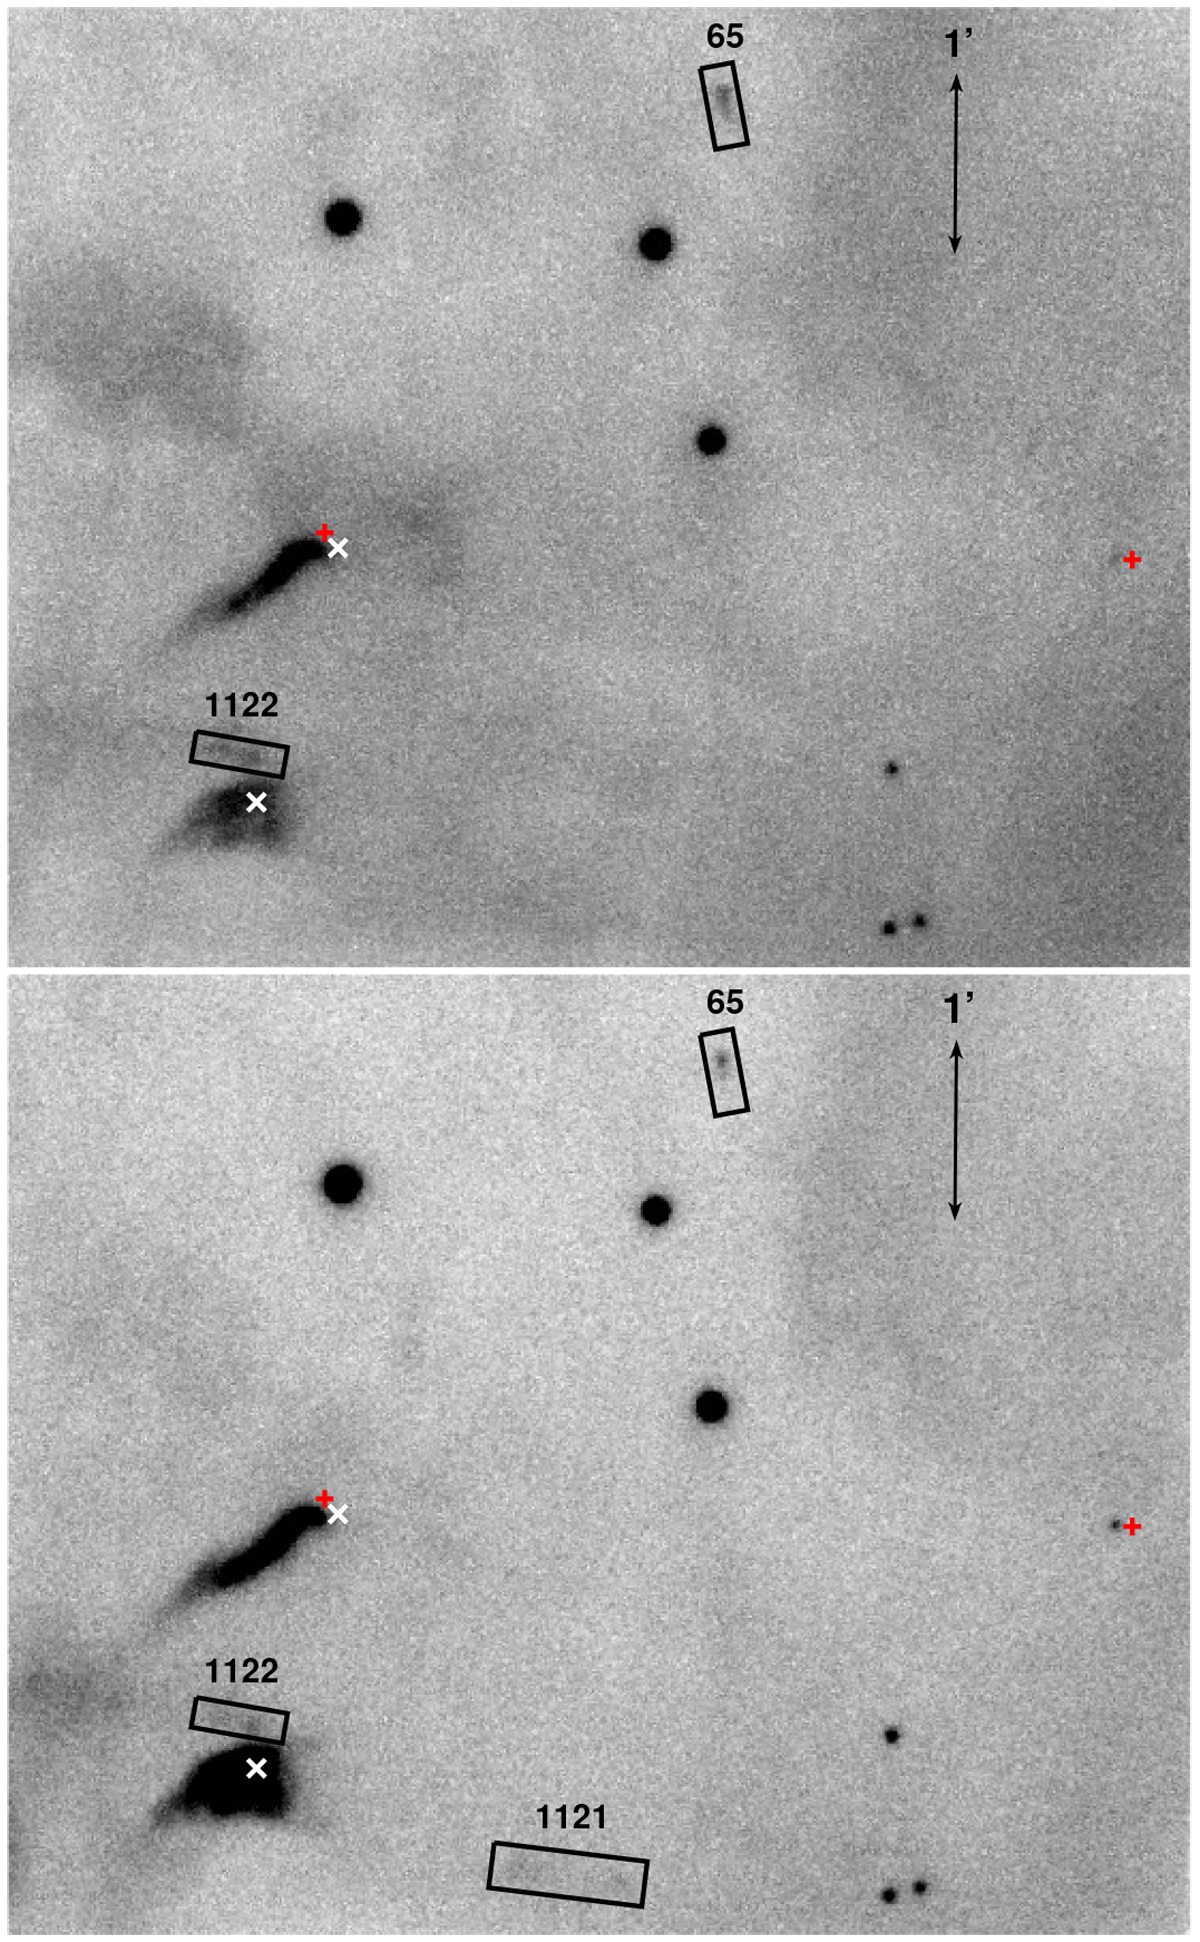
IRAS 05380−0728: Close-up of the CAHA image through the Hα (top) and [S II] (bottom) filters. The positions of the red nebulous objects are shown as a white cross (×), and that of the IRAS sources as a red plus sign (+). Black rectangles give the locations of the emission line features reported in the field.
Current usage metrics show cumulative count of Article Views (full-text article views including HTML views, PDF and ePub downloads, according to the available data) and Abstracts Views on Vision4Press platform.
Data correspond to usage on the plateform after 2015. The current usage metrics is available 48-96 hours after online publication and is updated daily on week days.
Initial download of the metrics may take a while.