Free Access
Fig. 11
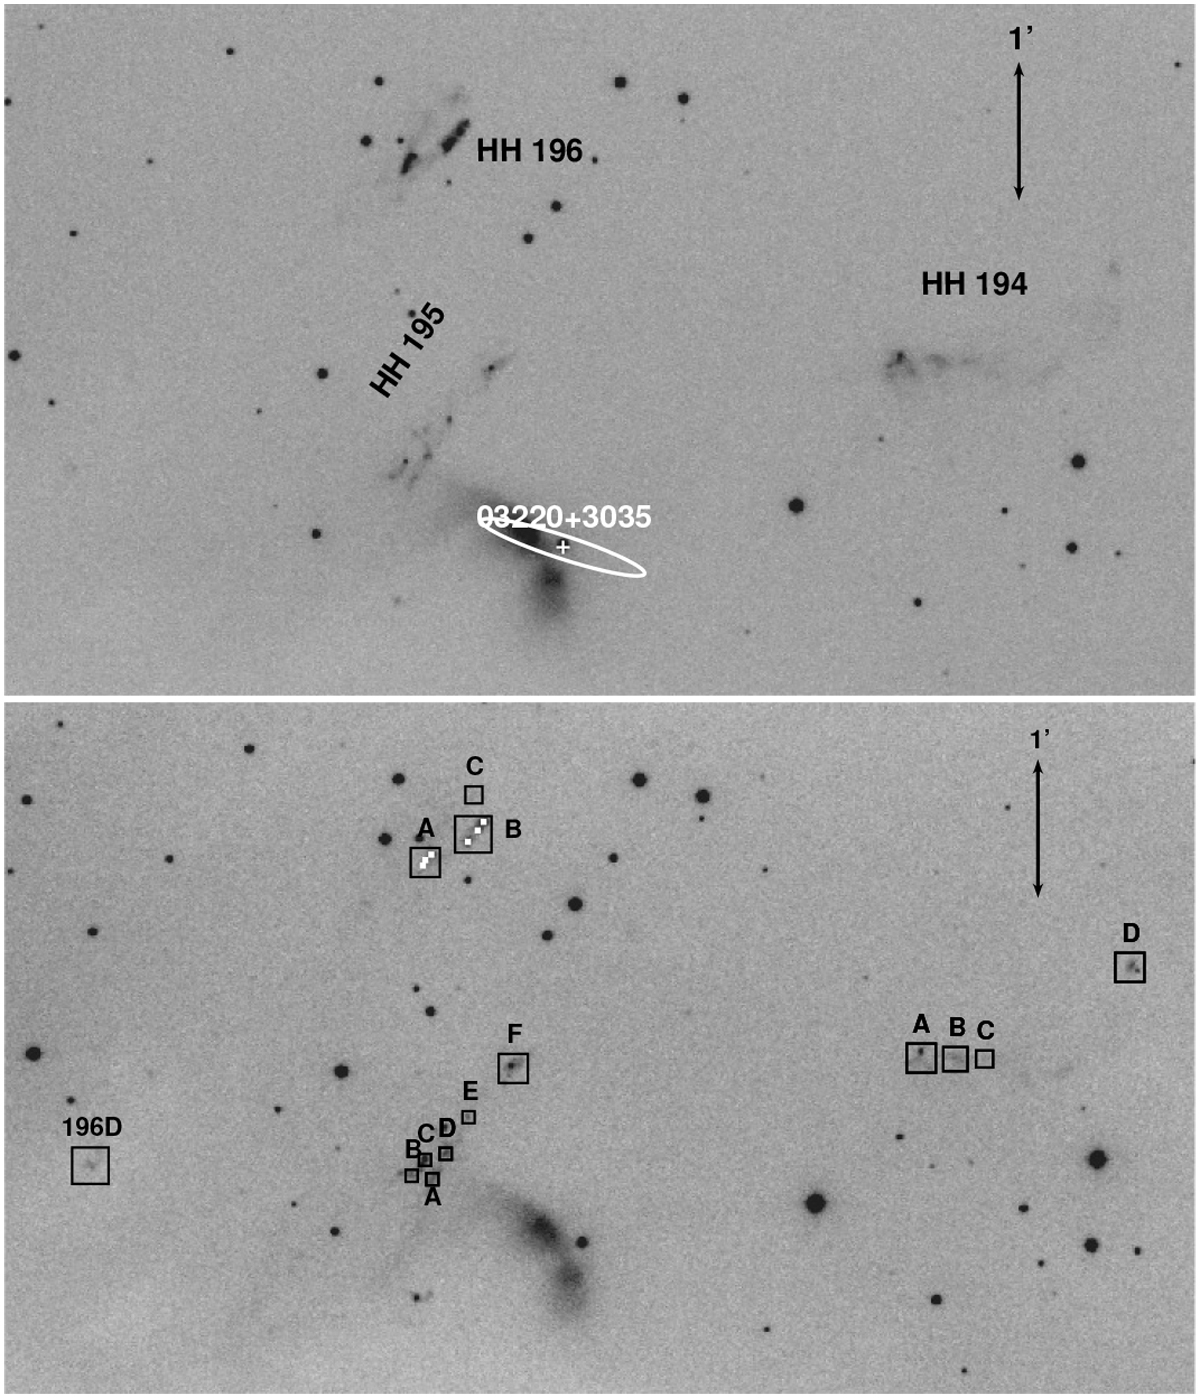
IRAS 03220+3035: Close-up of the CAHA image through the Hα filter (top) and [S II] filter (bottom), showing the field around the IRAS source. The HH objects detected (194, 195, 196) are identified (top), and the knots listed in Table 4 are labeled, enclosed in boxes (bottom).
Current usage metrics show cumulative count of Article Views (full-text article views including HTML views, PDF and ePub downloads, according to the available data) and Abstracts Views on Vision4Press platform.
Data correspond to usage on the plateform after 2015. The current usage metrics is available 48-96 hours after online publication and is updated daily on week days.
Initial download of the metrics may take a while.