Fig. 1
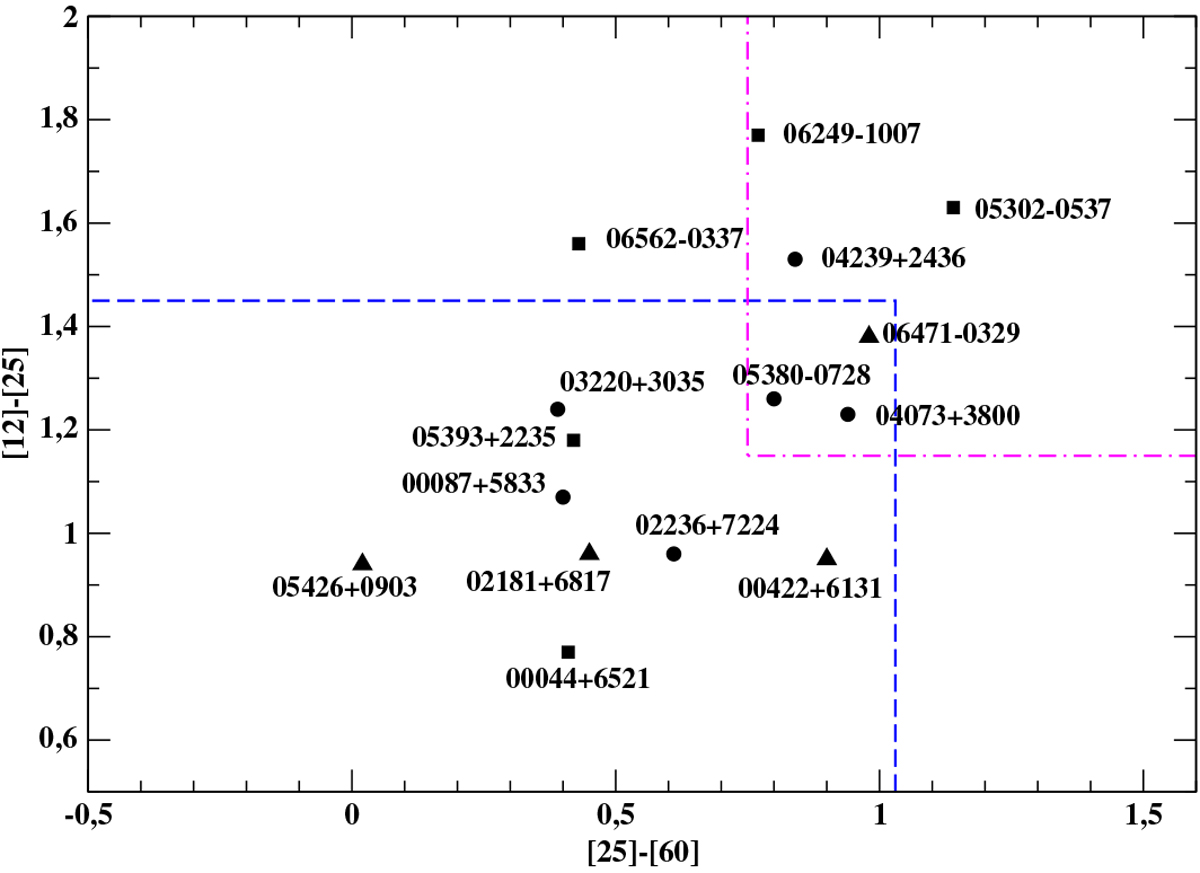
Location of the IRAS sources observed in the ([12]–[25], [25]–[60]) color–color diagram. The blue lines indicate the region of young stellar objects, and the magenta lines that of ultra-compact H II regions. Circles correspond to the driving jets of the sources, squares correspond to the sources with extended nebular emission, and triangles correspond to the point-like sources (see Table 1).
Current usage metrics show cumulative count of Article Views (full-text article views including HTML views, PDF and ePub downloads, according to the available data) and Abstracts Views on Vision4Press platform.
Data correspond to usage on the plateform after 2015. The current usage metrics is available 48-96 hours after online publication and is updated daily on week days.
Initial download of the metrics may take a while.