Fig. 10.
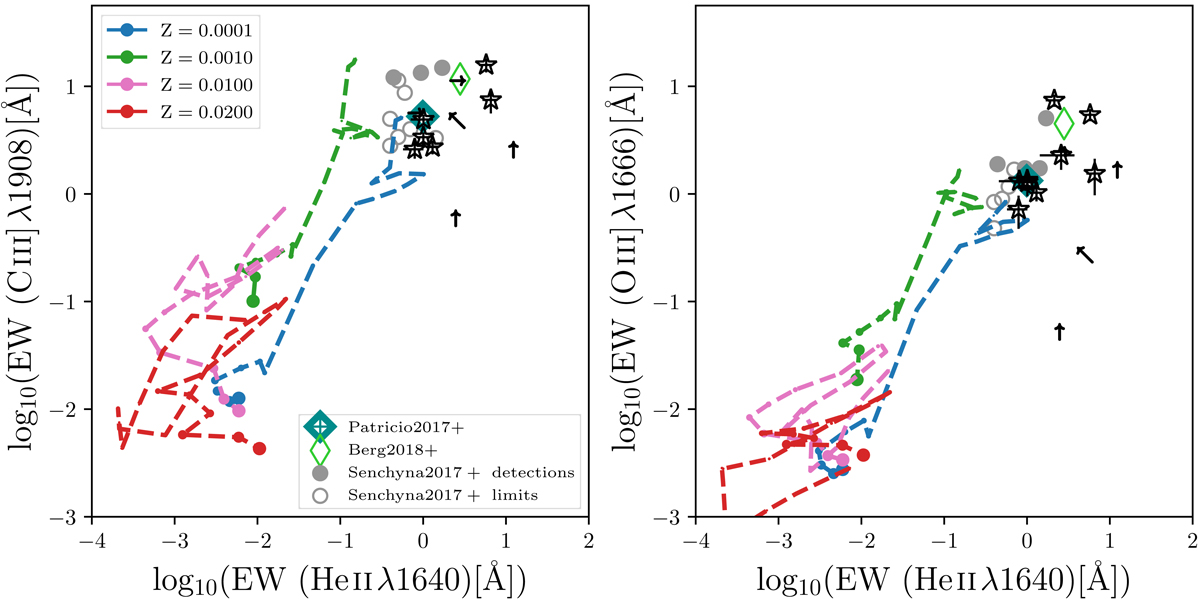
EW comparison of the MUSE He II λ1640 sample using BPASS stellar population models. Left: C III]λ1907+C III]λ1909 EW vs. He II λ1640 EW. Right: O III]λ1666 EW vs. He II λ1640 EW. Galaxies with S/N ≥ 2.5 are shown by stars, and others are shown as lower limits to the EW as triangles. We compare our observed EWs with model tracks from the Xiao et al. (2018) BPASS binary tracks. Models were computed for a log10(nH) = 1.0 and Us = −1.5 at different metallicities between 2 Z⊙ to 1/200th Z⊙. The size of the symbols increases with time. EWs from the literature are also shown for comparison.
Current usage metrics show cumulative count of Article Views (full-text article views including HTML views, PDF and ePub downloads, according to the available data) and Abstracts Views on Vision4Press platform.
Data correspond to usage on the plateform after 2015. The current usage metrics is available 48-96 hours after online publication and is updated daily on week days.
Initial download of the metrics may take a while.