Fig. 4.
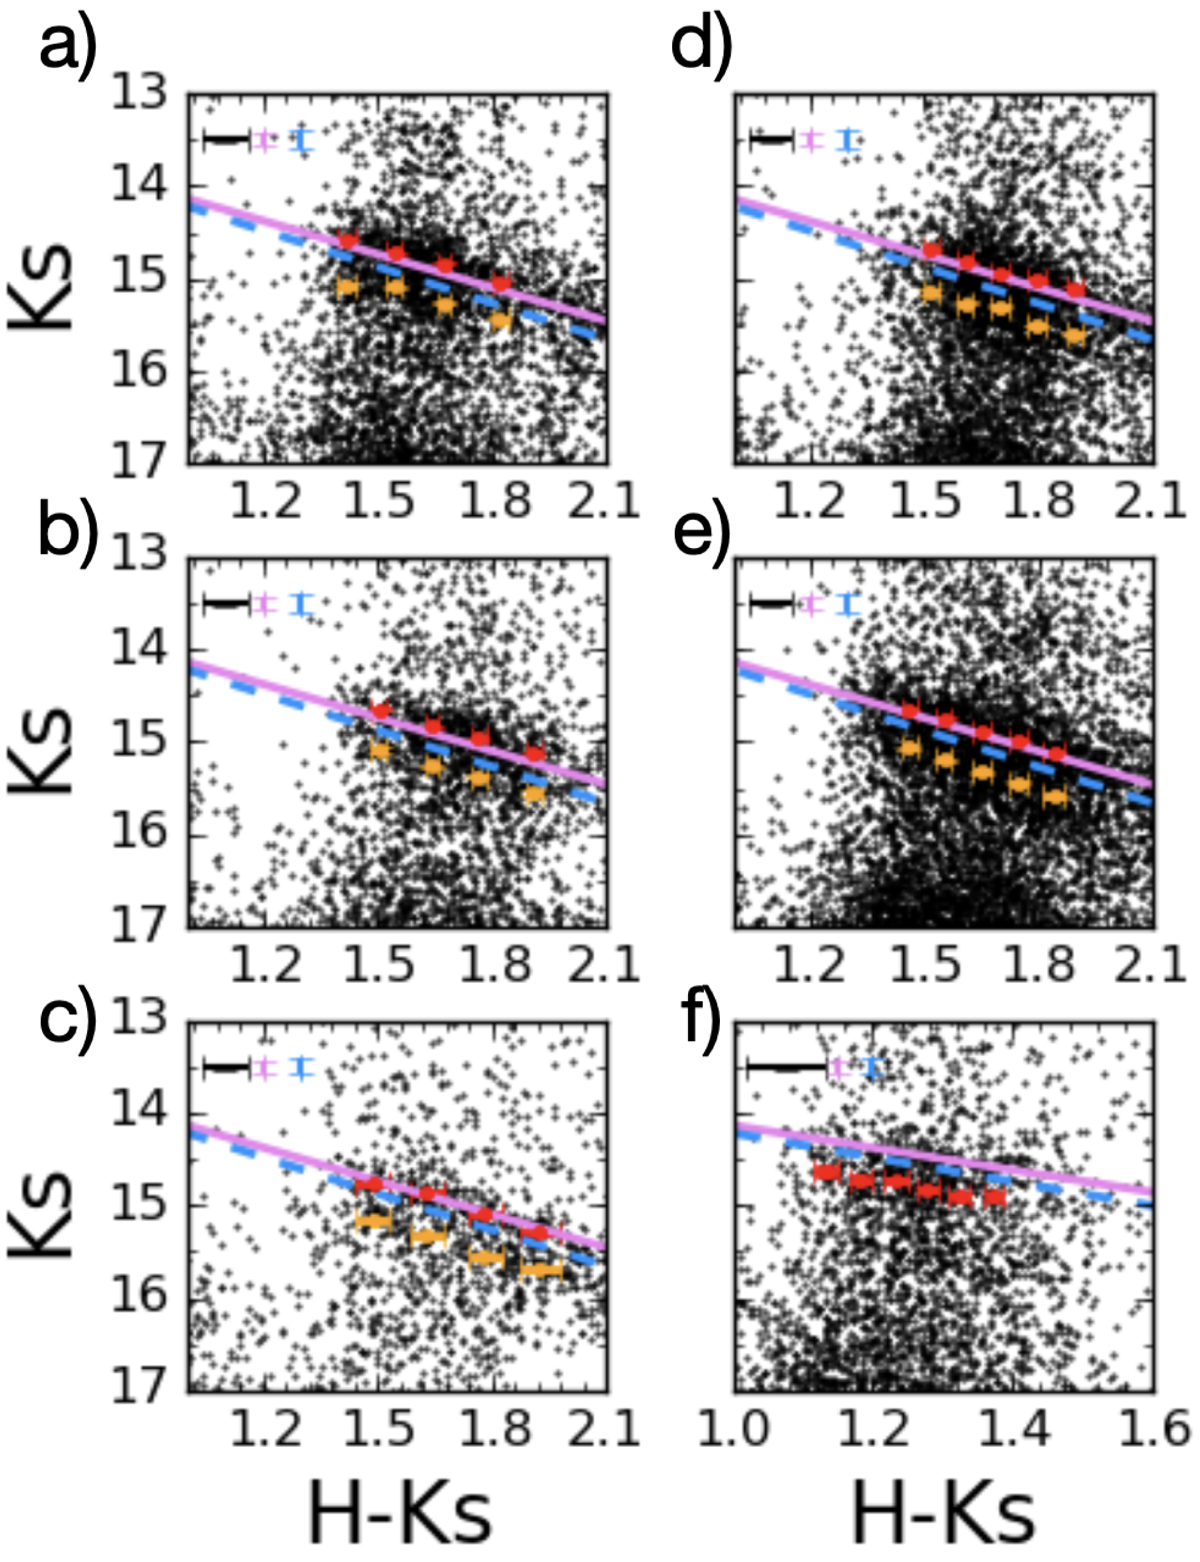
Colour magnitude diagrams Ks vs. H − Ks of the target regions: the 50 km s−1 cloud (panel a), the 20 km s−1 cloud (b), the Brick cloud (c), Control 1 (d), Control 2 (e), and the bulge region (f). The red and orange points indicate the detected double feature for the RC. The solid violet line corresponds to the reddening line of RC stars at an 8.2 kpc distance following the extinction curve from Nogueras-Lara et al. (2020b). The dashed blue line shows the extinction curve from Minniti et al. (2020). The black, violet, and blue error bars correspond to the systematics of the data and the two extinction curves, respectively.
Current usage metrics show cumulative count of Article Views (full-text article views including HTML views, PDF and ePub downloads, according to the available data) and Abstracts Views on Vision4Press platform.
Data correspond to usage on the plateform after 2015. The current usage metrics is available 48-96 hours after online publication and is updated daily on week days.
Initial download of the metrics may take a while.