Fig. 2.
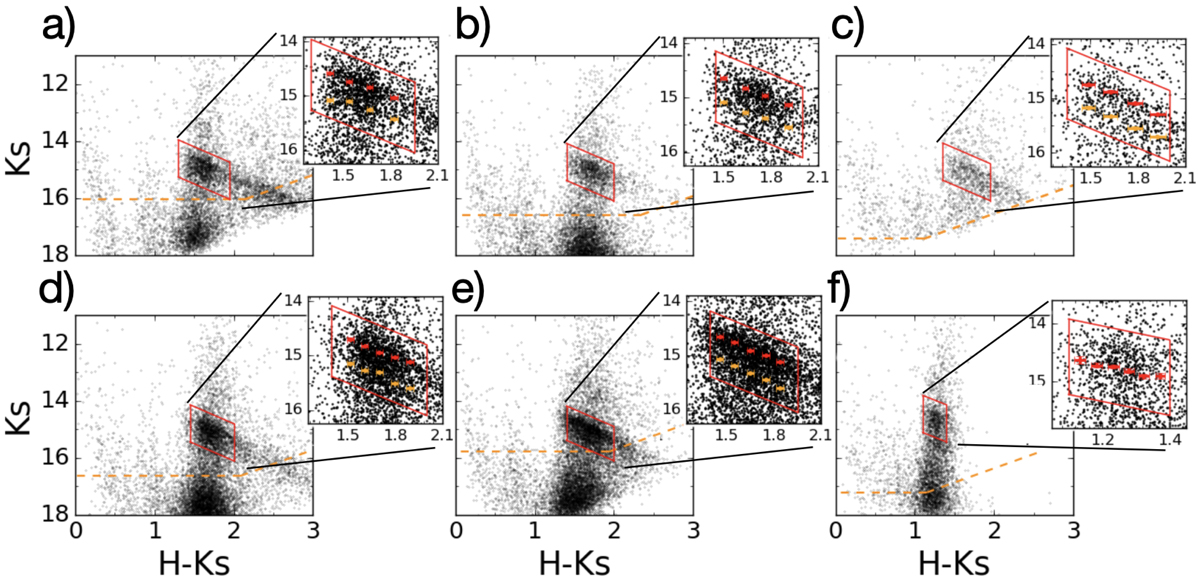
Colour magnitude diagrams Ks vs. H − Ks of the target regions: the 50 km s−1 cloud (panel a), the 20 km s−1 cloud (b), the Brick cloud (c), Control 1 (d), Control 2 (e), and the bulge region (f). The red parallelograms show the RC feature and the cut applied for the foreground population. The insets are zoom-ins on the RC regions where we detect a double RC (Sect. 3.1). The red and orange points correspond to the best fit obtained for the two RC features and indicate the 1σ uncertainties. The dashed orange lines mark the 80% completeness level.
Current usage metrics show cumulative count of Article Views (full-text article views including HTML views, PDF and ePub downloads, according to the available data) and Abstracts Views on Vision4Press platform.
Data correspond to usage on the plateform after 2015. The current usage metrics is available 48-96 hours after online publication and is updated daily on week days.
Initial download of the metrics may take a while.