Fig. 7.
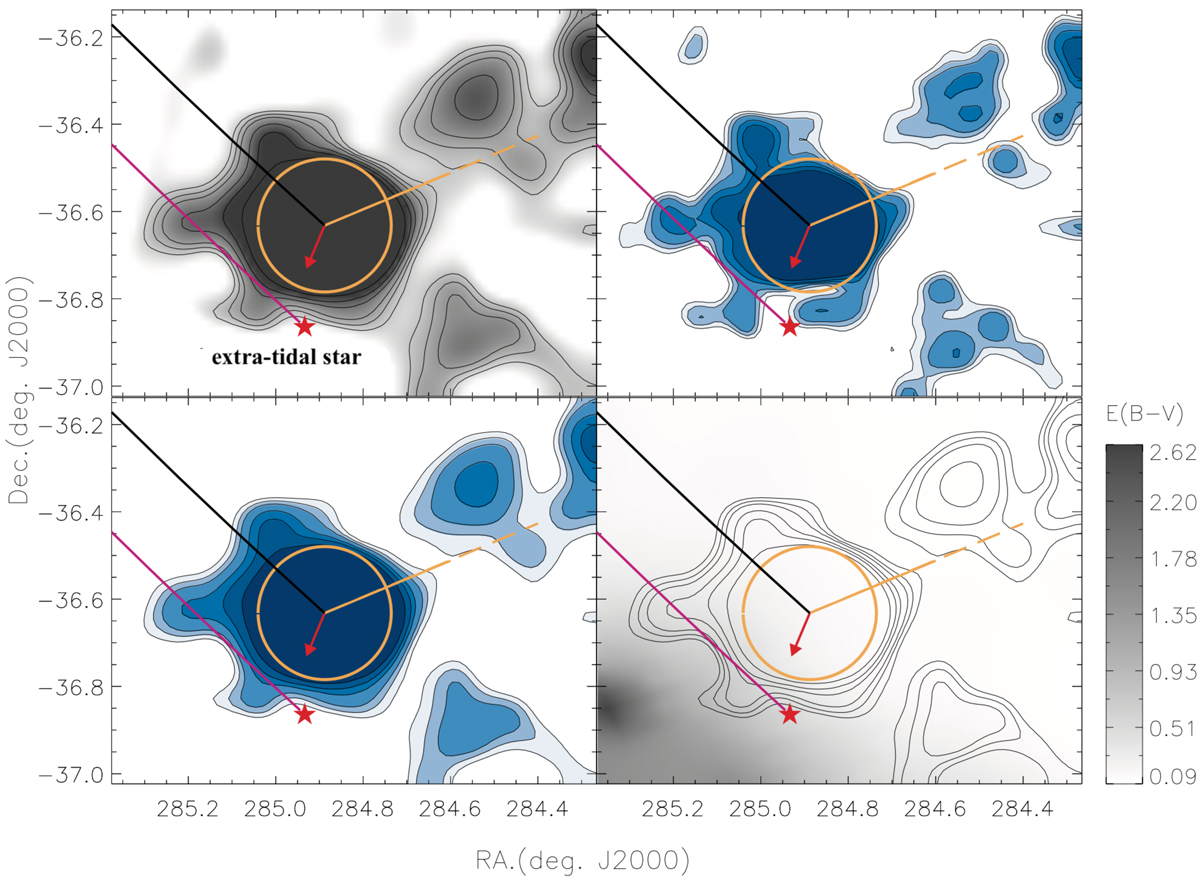
Modified Fig. 10 from Chun et al. (2015). The red ‘star’ symbol shows the position of the newly identified extra-tidal star. The orange circle indicates the cluster tidal radius (rt = 9.14 ± 0.49′, see Sect. 8), and the red arrow defines the proper motion of NGC 6723 from Baumgardt et al. (2019). The orange solid and dashed line shows the direction of the Galactic Centre and Galactic plane, respectively. Top-left panel: star-count map around the cluster; the top-right panel is the surface-density map, smoothed by a Gaussian kernel 0.07°; the lower-left panel is the same data, but smoothed with a 0.11° kernel; the bottom-right panel shows the distribution map of E(B − V). The iso-density contour levels shown are 2.0σ, 2.5σ, 3.0σ, 4.0σ, 5.0σ, and 7.0σ. The orbital path of the cluster (black line) and the extra-tidal star (purple line) is over-plotted.
Current usage metrics show cumulative count of Article Views (full-text article views including HTML views, PDF and ePub downloads, according to the available data) and Abstracts Views on Vision4Press platform.
Data correspond to usage on the plateform after 2015. The current usage metrics is available 48-96 hours after online publication and is updated daily on week days.
Initial download of the metrics may take a while.