Fig. 2.
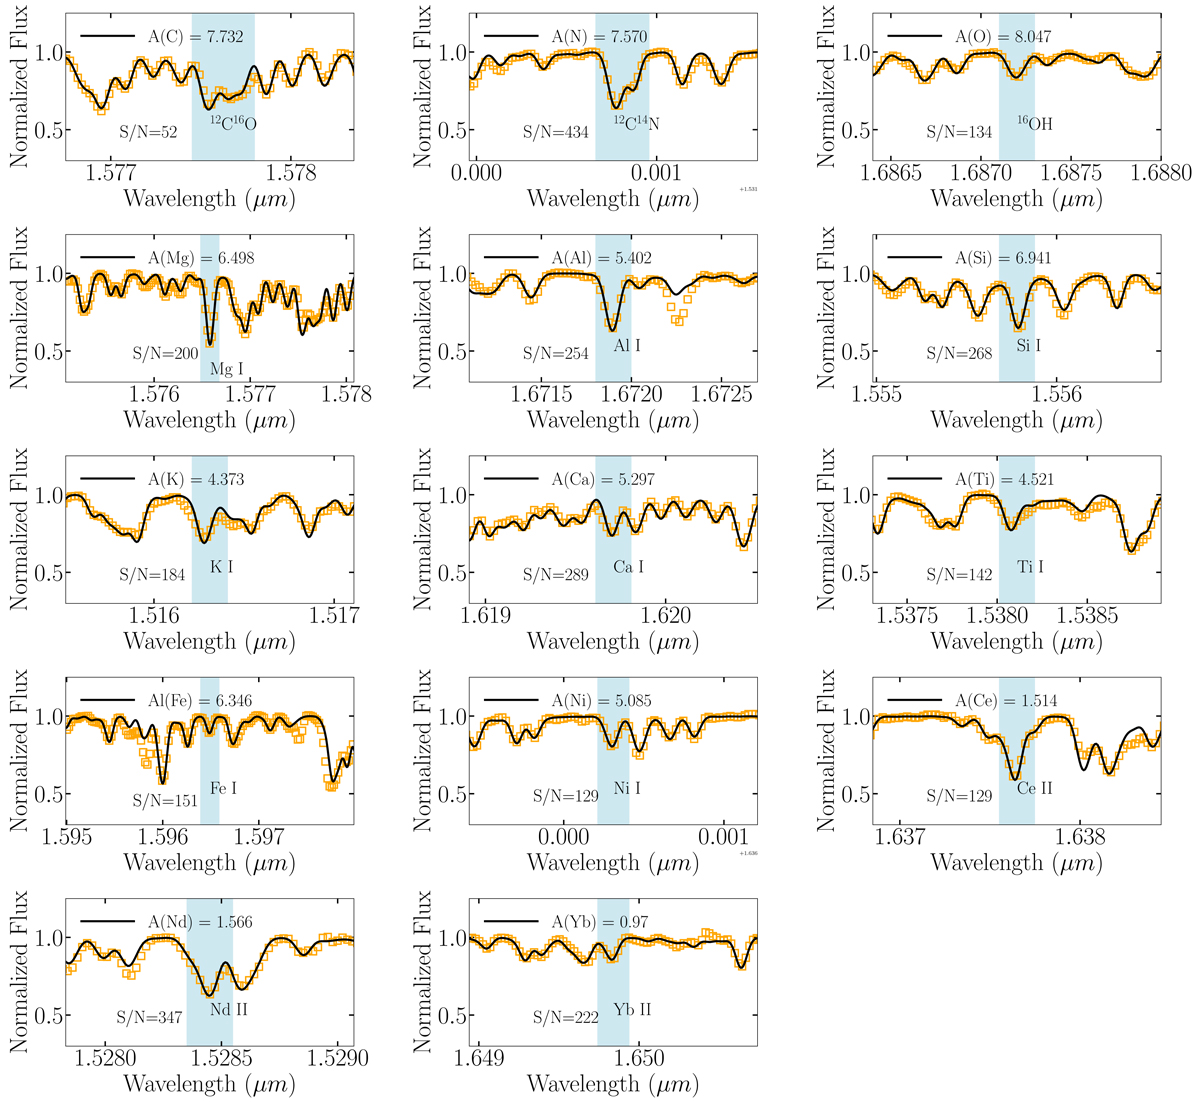
High-resolution near-IR H-band spectrum of the extra-tidal star. The spectral regions are shown with orange squares. Superimposed is the best-fit of a MARCS/BACCHUS spectral synthesis (black line). The light blue shaded regions show the strength of the molecules (12C16O, 12C14N, 16OH), and the atomic lines, namely the α-elements (Mg I, Si I, Ca I, Ti I), the odd-Z elements (Al I, K I), the iron-peak elements (Fe I, Ni I), and the s-process elements (Ce II, ND II, Yb II), expressed in air wavelengths. The legends in each panel show the absolute abundance, A(X), of the species under consideration, and the signal-to-noise (S/N) in the regions of the features, respectively.
Current usage metrics show cumulative count of Article Views (full-text article views including HTML views, PDF and ePub downloads, according to the available data) and Abstracts Views on Vision4Press platform.
Data correspond to usage on the plateform after 2015. The current usage metrics is available 48-96 hours after online publication and is updated daily on week days.
Initial download of the metrics may take a while.