Fig. 1.
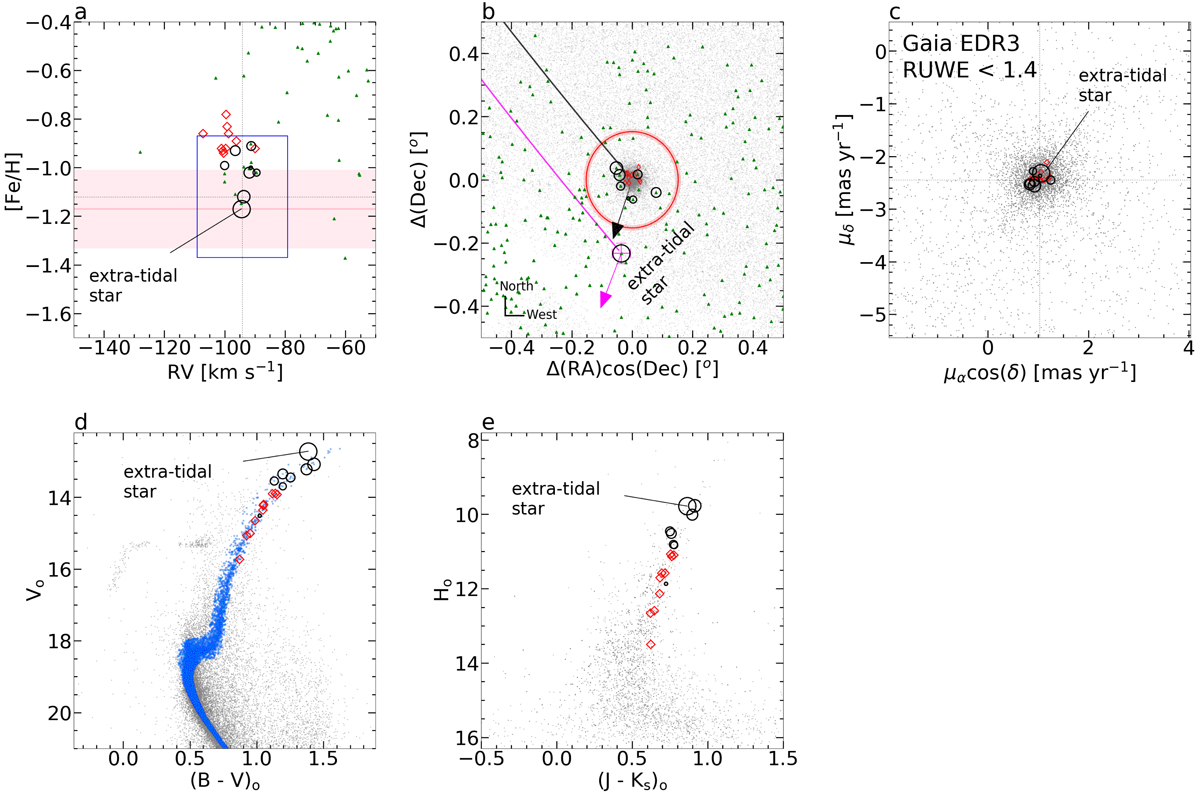
Properties of the extra-tidal star compared with likely members of NGC 6723. Panel a: metallicity – radial velocity plane for stars in the APOGEE-2 catalogue in the region of NGC 6723 (green triangles). The black open circles are potential members of NGC 6723; sizes reflect their Vo magnitudes, with decreasing size for fainter magnitudes. The pink line and shaded region indicate the ⟨[Fe/H]⟩ ± σ[Fe/H] of the extra-tidal star. The black dotted lines indicate the nominal [Fe/H] and radial velocity of NGC 6723 from Harris (1996, 2010). The red unfilled diamonds refer to probable members analysed in the literature (Crestani et al. 2019). The blue rectangle indicates the region adopted to choose potential cluster members, based on radial velocity and metallicity (see Sect. 2). Panel b: positions for stars in the APOGEE-2 and Gaia EDR3 (grey dots) catalogues in the region of NGC 6723. The magenta cross symbol indicates the Gaia astrometric uncertainty. The big red and shadow circumference show the cluster tidal radius (rt = 9.14 ± 0.49′) of NGC 6723 determined in this work from HST + Gaia EDR3 data set (see Sect. 8). The orbital paths of the cluster (black line) and the extra-tidal star (magenta line) are shown, along with the proper motion vectors (black arrow) of the cluster from Baumgardt et al. (2019), and the extra-tidal star (magenta arrow); their lengths (scaled up for visibility) and directions are essentially identical. Panel c: proper-motion plane for the selected candidates. Panels d and e: Vo versus (B − V)o and 2MASS Ho versus (J − Ks)o Colour-Magnitude Diagram (CMD) centred on NGC 6723, showing all the stars within the cluster tidal radius, and the probable cluster members (cyan symbols) within a 2σ deviation from the best isochrone fitting (Souza et al. 2020; Oliveira et al. 2020). The largest open circle in all panels indicate the extra-tidal star.
Current usage metrics show cumulative count of Article Views (full-text article views including HTML views, PDF and ePub downloads, according to the available data) and Abstracts Views on Vision4Press platform.
Data correspond to usage on the plateform after 2015. The current usage metrics is available 48-96 hours after online publication and is updated daily on week days.
Initial download of the metrics may take a while.