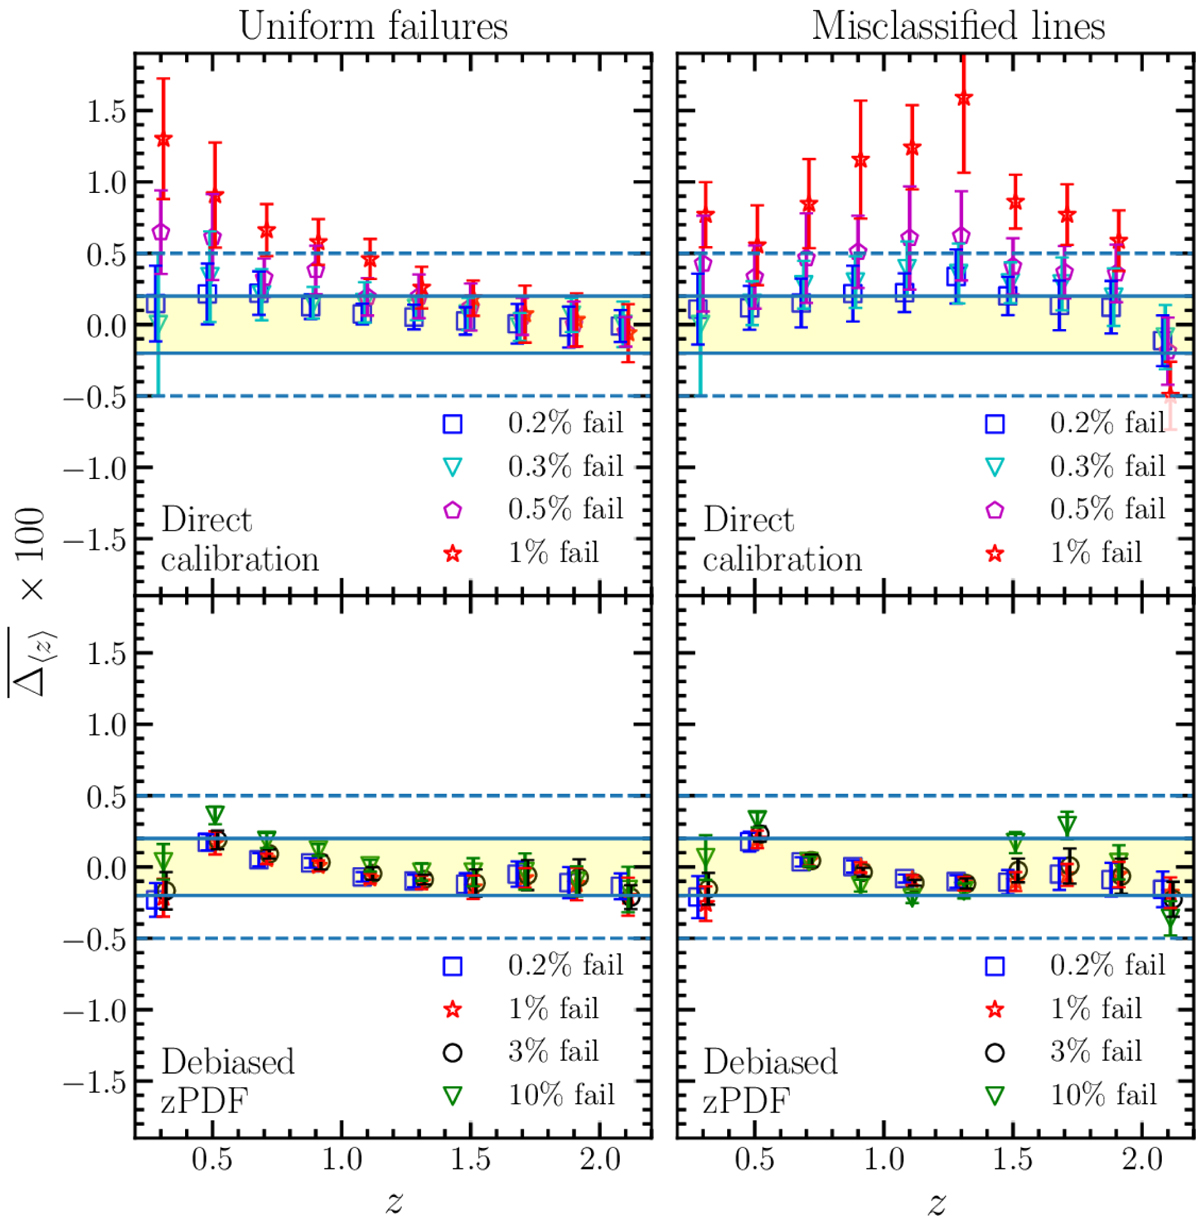
Fig. 6.

Bias on the mean redshift averaged over the 18 photometric noise realisations in the LSST/Euclid case. We assume a SOM training sample, and the different symbols correspond to various fractions of failure introduced in the spec-z training sample. Left and right panels: correspond to different assumptions on how to distribute the catastrophic failures in the spec-z measurements: uniformly distributed between 0 < z < 4 (left) and assuming the failures are caused by misclassified emission lines (right). Upper and lower panels: correspond to the direct calibration and de-biasing methods, respectively.
Current usage metrics show cumulative count of Article Views (full-text article views including HTML views, PDF and ePub downloads, according to the available data) and Abstracts Views on Vision4Press platform.
Data correspond to usage on the plateform after 2015. The current usage metrics is available 48-96 hours after online publication and is updated daily on week days.
Initial download of the metrics may take a while.


